博文
2023-2024年全球变暖加速:太阳活动超过温室效应成为首选因素
||
2023-2024年全球变暖加速:太阳活动超过温室效应成为首选因素
杨学祥,杨冬红
全球气温连续13个月创新高 今年6月为有记录以来最热6月
广州日报2024-07-09 13:03广东
欧盟气候监测机构哥白尼气候变化服务局负责人布翁滕波8日表示,截至今年6月,全球气温连续13个月创下新高,且连续12个月比工业化前水平高出1.5摄氏度。数据还显示,今年6月,全球平均地表气温为16.66摄氏度,比2023年6月高0.14摄氏度,为有记录以来的最热6月。
来源:@央视财经图/广州日报新花城记者:吴子良广州日报新花城编辑:陈婷婷
https://baijiahao.baidu.com/s?id=1804076472219774379&wfr=spider&for=pc
为什么2023年6月至2024年6月全球最热月创纪录?因为他对应太阳黑子活跃期。
美国学者的困惑和中国学者的探索
美国国家航空航天局戈达德空间研究所所长Schmidt G先生最近撰文指出,自2016年以来,我每年年初都会进行气候预测。承认没有一年比2023年更让气候科学家的预测能力感到困惑,这让人感到羞愧,也有点担心。
在过去的九个月里,陆地和海面的平均温度每月都比以前的记录高出0.2°C,这在全球尺度上是一个巨大的增幅。由于温室气体排放量的增加,预计会出现普遍的变暖趋势,但这一突然的高温峰值大大超过了基于过去观测的统计气候模型的预测。造成这种差异的许多原因已经被提出,但到目前为止,还没有将它们结合起来,使我们的理论与所发生的情况相一致。
Schmidt G, Climate models can’t explain 2023’s huge heat anomaly – we could be in uncharted territory, Nature, 2024. 627(8004): 467-467.
周少祥教授认为,现有的气候模型不能解释全球变暖夜间增温幅度更大的历史数据,Schmidt的文章说明,它也不能对未来的气候变暖做出准确的预测,说明全球气候变暖并非人为二氧化碳排放所致。问题的关键在于,水蒸汽凝结是通过辐射释放潜热的,是大气核心温室效应,二氧化碳的温室效应完全不能比拟。但是,这一物理机制不被认识和接受,我的文章清晰地回答了这一问题,却发表不了。
太阳黑子高值参与了全球变暖
我们多年潮汐组合预报实践表明,潮汐组合类型转换具有13.6天周期,即双周循环,预报图中都有明显的表现。除此之外,两周之内厄尔尼诺指数往往出现两个峰值和两个谷值,即次一级的7天周期。这一 周期在气温变化中也有明显的表现。
https://blog.sciencenet.cn/home.php?mod=space&uid=2277&do=blog&id=1388780
强潮汐组合控制强潮汐南北震荡的幅度,是赤道太平洋海温的重要控制因素。根据潮汐组合预报,2023年1-2月、6-8月、12月有利于厄尔尼诺的形成;3-5月、9-11月有利于拉尼娜形成。所以,厄尔尼诺发生在2023年6-8月的可能性最大。
https://blog.sciencenet.cn/blog-2277-1378601.html
https://blog.sciencenet.cn/blog-2277-1361960.html
月亮赤纬角最小值对应厄尔尼诺指数下降区间,月亮赤纬角最大值对应上升区间,
潮汐不仅有13.6天周期,而且存在7.1天和9.1天周期。1921年杜德生对月亮和太阳引潮力位进行了严格的调和级数展开,在展开中约有90项长周期成分。其中振幅超过这90项长周期振幅之和的0.5%的共有20个,在这20个中就有9天项和7天项。
NASA的SABER卫星首次观测到因周期性的高速太阳风而产生的地球上层大气层的“呼吸”——一种膨胀和收缩的活动。根据美国最新的卫星观测结果,地球大气层正在有序地扩大和收缩,平均每九天就有一个周期!地球似乎在缓慢地呼吸,地球每天都在波动,在0.5到0.8米的范围内波动。
随着太阳的27天的自转周期,这些太阳风通常以9天为周期冲击地球。高速太阳风有时候显示出的是七天的周期性。
http://blog.sciencenet.cn/blog-2277-1288792.html
https://blog.sciencenet.cn/blog-2277-1358948.html
https://blog.sciencenet.cn/blog-2277-1358222.html
https://blog.sciencenet.cn/blog-2277-1358222.html
对厄尔尼诺和拉尼娜有影响的因素有南极半岛海冰(周期性因素)、强潮汐南北震荡(周期性因素)、环太平洋地震带强震(突发性因素)、强潮汐组合和太阳风7-9天周期(周期性因素)。综合叠加结果决定厄尔尼诺指数的升降。
每年2月南极半岛海冰面积最小,赤道太平洋海温最暖;9月最大,赤道太平洋海温最冷,南极半岛海冰开关控制秘鲁寒流的强弱。进入10月,南极半岛海冰减少,减弱秘鲁寒流,有利于厄尔尼诺发展,
环太平洋地震带强震频发导致深海冷水上翻。
https://blog.sciencenet.cn/blog-2277-1378601.html
太阳风7-9天周期对厄尔尼诺影响在2023年7月最为显著,
https://blog.sciencenet.cn/home.php?mod=space&uid=2277&do=blog&id=1397129
值得关注的是,8月30日至9月1日最强潮汐组合的作用被太阳风7-9日上升期压制,类似情况8月已经出现多次。8月25日至9月1日厄尔尼诺指数太阳风7-9日周期非常显著。
太阳风压缩大气层,背光方向形成气尾,向光方向形成臭氧洞(或臭氧稀薄区)。这是大气异常流动的结果。
两极臭氧洞首先是自然的产物。极夜和极昼的交替,极涡和低温条件,火山灰向极地的集中,臭氧洞在南北两极的轮换,都是自然规律运作的结果,远非人力所能控制。
https://blog.sciencenet.cn/blog-2277-1371993.html
同理,太阳风也压缩了海洋圈,形成背光的海洋尾。
由于地球自转,除了两极地区外,地球背光的大气尾和海洋尾是绕固体地球由东向西旋转的。太阳风压缩大气圈和海洋圈因为7-9天周期的波动,会显著的影响赤道太平洋的气流和海流,进而控制厄尔尼诺指数变化。
https://blog.sciencenet.cn/home.php?mod=space&uid=2277&do=blog&id=1402732
2023年7月太阳黑子达到本周期最大值145.26
||
2023年7月太阳黑子达到本周期最大值145.26
杨学祥
关键提示
继2022年12月太阳黑子出现110高值之后,2023年1月太阳黑子再次出现高值133.35,但是2023年2月减少,降为130.64,3月更少,降为108.55。4月最少,跌破100,降为88.33,5月回升为125.77,6月达到最大值140.57,7月达到最大值145.26,连续两月创新高。
7月太阳黑子峰值加快了厄尔尼诺的发展,是全球高温的重要原因之一,不利于新冠病毒的生存。
https://blog.sciencenet.cn/home.php?mod=space&uid=2277&do=blog&id=1396747
https://blog.sciencenet.cn/home.php?mod=space&uid=2277&do=blog&id=1396734
https://blog.sciencenet.cn/blog-2277-1397110.html
相关图表
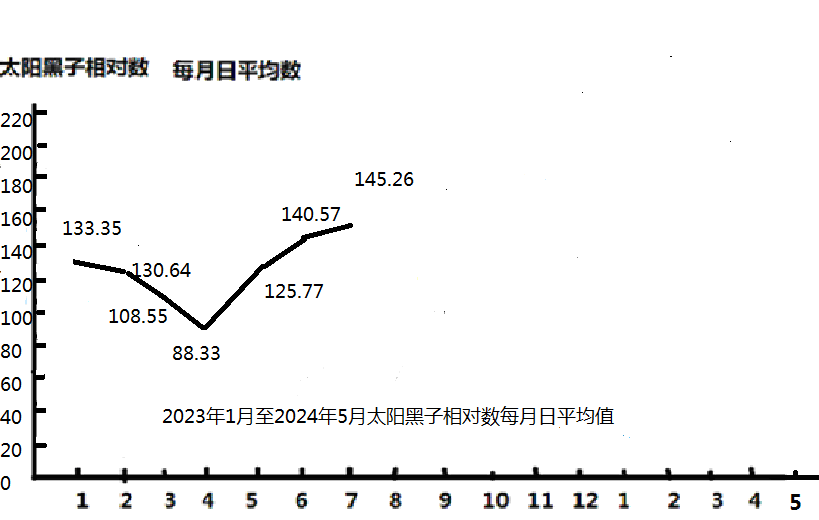

图1 2022年12月至2023年7月太阳黑子相对数日平均数(2022年12月太阳黑子异常峰值110,2023年1月出现更高值133.35,2月降为130.64,3月降为108.55,4月降为88.33,5月止跌回升为125.77,6月达到最高值140.57,7月达到最大值145.26。最高纪录保持至今)
https://blog.sciencenet.cn/blog-2277-1370086.html
https://news.sina.com.cn/c/2023-01-01/doc-imxysqvc2427697.shtml
https://blog.sciencenet.cn/blog-2277-1370131.html
https://blog.sciencenet.cn/blog-2277-1370132.html
https://blog.sciencenet.cn/blog-2277-1370600.html
https://blog.sciencenet.cn/blog-2277-1386423.html
:Product: Daily Solar Data DSD.txt
:Issued: 0225 UT 01 Aug 2023
#
# Prepared by theU.S.Dept. of Commerce, NOAA, Space Weather Prediction Center
# Please send comments and suggestions to SWPC.Webmaster@noaa.gov
#
# Last 30 Days Daily Solar Data
#
# Sunspot Stanford GOES15
# Radio SESC Area Solar X-Ray ------ Flares ------
# Flux Sunspot 10E-6 New Mean Bkgd X-Ray Optical
# Date 10.7cm Number Hemis. Regions Field Flux C M X S 1 2 3
#---------------------------------------------------------------------------
2023 07 01 166 119 1290 3 -999 * 9 1 0 14 0 0 0
2023 07 02 170 126 1350 1 -999 * 8 1 1 17 0 0 0
2023 07 03 173 117 1400 0 -999 * 14 1 0 29 2 0 0
2023 07 04 167 121 1310 1 -999 * 9 1 0 8 0 0 0
2023 07 05 154 101 270 1 -999 * 10 1 0 6 1 0 0
2023 07 06 158 149 980 2 -999 * 7 1 0 14 1 0 0
2023 07 07 161 147 910 2 -999 * 4 1 0 24 0 1 0
2023 07 08 161 167 830 1 -999 * 9 0 0 6 1 0 0
2023 07 09 179 183 950 2 -999 * 8 0 0 22 0 0 0
2023 07 10 191 181 1290 1 -999 * 12 2 0 40 4 1 0
2023 07 11 214 227 1860 2 -999 * 8 6 0 45 0 0 0
2023 07 12 193 219 2140 0 -999 * 10 4 0 24 4 0 0
2023 07 13 203 146 1870 0 -999 * 13 1 0 13 3 1 0
2023 07 14 181 141 1960 2 -999 * 10 1 0 17 1 0 0
2023 07 15 179 96 1690 0 -999 * 7 3 0 17 1 1 0
2023 07 16 184 99 1700 0 -999 * 15 3 0 15 2 1 0
2023 07 17 180 149 1980 3 -999 * 18 2 0 19 0 0 0
2023 07 18 219 142 1850 0 -999 * 9 5 0 14 0 0 0
2023 07 19 189 141 1660 2 -999 * 15 2 0 8 0 0 0
2023 07 20 184 131 1570 0 -999 * 5 0 0 8 0 0 0
2023 07 21 173 121 1500 0 -999 * 2 0 0 11 0 0 0
2023 07 22 174 103 1320 0 -999 * 3 2 0 8 2 1 0
2023 07 23 173 117 1300 1 -999 * 5 0 0 15 2 1 0
2023 07 24 165 141 1145 3 -999 * 8 0 0 28 0 1 0
2023 07 25 169 137 1110 1 -999 * 7 2 0 15 1 1 0
2023 07 26 167 147 955 2 -999 * 10 3 0 14 4 1 0
2023 07 27 165 154 1010 3 -999 * 15 2 0 17 0 0 0
2023 07 28 168 148 1210 1 -999 * 9 1 0 13 0 0 0
2023 07 29 179 147 1140 1 -999 * 6 1 0 16 1 0 0
2023 07 30 174 139 1010 0 -999 * 4 2 0 23 3 0 0
2023 07 31 177 197 1290 2 -999 * 7 1 0 18 1 1 0
ftp://ftp.swpc.noaa.gov/pub/indices/DSD.txt
2023年7月1-31日太阳黑子总数:4503,日平均:145.26.
https://blog.sciencenet.cn/blog-2277-1397461.html
2023-2025年为月亮赤纬角最大值时期和太阳黑子最大值时期,与强潮汐叠加,可激发地震火山活动和冷暖空气活动(最强)。
https://blog.sciencenet.cn/blog-2277-1293301.html
2023年7月1-31日为太阳黑子持续时间最长、强度最大的峰值时期
7月24-28日太阳黑子峰值加快提升厄尔尼诺指数最显著。
https://blog.sciencenet.cn/home.php?mod=space&uid=2277&do=blog&quickforward=1&id=1399097
https://blog.sciencenet.cn/blog-2277-1399099.html
结论
太阳风和太阳黑子7-9天周期增温赤道太平洋表面海水,加快厄尔尼诺的发展,这一发现表明,太阳黑子活动是全球变暖的重要因素,2023年7月全球最暖和2023年全球最热新记录,证实太阳能量参与了全球变暖。应该列入气候模型。
相关论文
[转载]NATURE:气候模型无法解释2023年重大热异常——我们可能正处于未知领域
|||
按:自然(Nature)2024年3月发表了题为“Climate models can’t explain 2023’s huge heat anomaly – we could be in uncharted territory”文章,作者是美国国家航空航天局戈达德空间研究所所长Schmidt G先生。此文很有价值,特此记录于此。
Schmidt G, Climate models can’t explain 2023’s huge heat anomaly – we could be in uncharted territory, Nature, 2024. 627(8004): 467-467.
NATURE:气候模型无法解释2023年重大热异常——我们可能正处于未知领域
Gavin Schmidt
When I took over as the director of NASA’s Goddard Institute for Space Studies, I inherited a project that tracks temperature changes since 1880. Using this trove of data, I’ve made climate predictions at the start of every year since 2016. It’s humbling, and a bit worrying, to admit that no year has confounded climate scientists’ predictive capabilities more than 2023 has.
当我接任美国国家航空航天局戈达德空间研究所所长时,我继承了一个追踪1880年以来温度变化的项目。利用这些数据宝库,自2016年以来,我每年年初都会进行气候预测。承认没有一年比2023年更让气候科学家的预测能力感到困惑,这让人感到羞愧,也有点担心。
For the past nine months, mean land and sea surface temperatures have overshot previous records each month by up to 0.2 °C - a huge margin at the planetary scale. A general warming trend is expected because of rising greenhouse-gas emissions, but this sudden heat spike greatly exceeds predictions made by statistical climate models that rely on past observations. Many reasons for this discrepancy have been proposed but, as yet, no combination of them has been able to reconcile our theories with what has happened.
在过去的九个月里,陆地和海面的平均温度每月都比以前的记录高出0.2°C,这在全球尺度上是一个巨大的增幅。由于温室气体排放量的增加,预计会出现普遍的变暖趋势,但这一突然的高温峰值大大超过了基于过去观测的统计气候模型的预测。造成这种差异的许多原因已经被提出,但到目前为止,还没有将它们结合起来,使我们的理论与所发生的情况相一致。
For a start, prevalent global climate conditions one year ago would have suggested that a spell of record-setting warmth was unlikely. Early last year, the tropical Pacific Ocean was coming out of a three-year period of La Niña, a climate phenomenon associated with the relative cooling of the central and eastern Pacific Ocean. Drawing on precedents when similar conditions prevailed at the beginning of a year, several climate scientists, including me, put the odds of 2023 turning out to be a record warm year at just one in five.
首先,一年前普遍的全球气候状况表明,不太可能出现创纪录的温暖期。去年年初,热带太平洋刚刚结束为期三年的拉尼娜现象,这是一种与太平洋中部和东部相对偏低有关的气候现象。根据年初类似情况普遍存在的先例,包括我在内的几位气候科学家认为,2023年扭转成创纪录温暖年份的几率仅为五分之一。
El Niño — the inverse of La Niña — causes the eastern tropical Pacific Ocean to warm up. This weather pattern set in only in the second half of the year, and the current spell is milder than similar events in 1997–98 and 2015–16.
厄尔尼诺现象—与拉尼娜现象相反—导致东部热带太平洋变暖。这种天气形态只在去年下半年出现,目前的天气比1997-98年和2015-16年的类似事件要温和。
However, starting last March, sea surface temperatures in the North Atlantic Ocean began to shoot up. By June, the extent of sea ice around Antarctica was by far the lowest on record. Compared with the average ice cover between 1981 and 2010, a patch of sea ice roughly the size of Alaska was missing. The observed temperature anomaly has not only been much larger than expected, but also started showing up several months before the onset of El Niño.
然而,从去年3月开始,北大西洋的海面温度开始飙升。到6月,南极洲周围的海冰范围是迄今为止有记录以来最低的。与1981年至2010年的平均冰盖相比,大约相当于阿拉斯加大小的一块海冰消失了。观测到的温度异常不仅比预期的要大得多,而且在厄尔尼诺现象爆发前几个月就开始出现。
So, what might have caused this heat spike? Atmospheric greenhouse-gas levels have continued to rise, but the extra load since 2022 can account for further warming of only about 0.02 °C. Other theories put forward by climate scientists include fallout from the January 2022 Hunga Tonga - Hunga Ha‘apai volcanic eruption in Tonga, which had both cooling effects from aerosols and warming ones from stratospheric water vapour, and the ramping up of solar activity in the run-up to a predicted solar maximum. But these factors explain, at most, a few hundredths of a degree in warming (Schoeberl, M. R. et al. Geophys. Res. Lett. 50, e2023GL104634; 2023). Even after taking all plausible explanations into account, the divergence between expected and observed annual mean temperatures in 2023 remains about 0.2 °C - roughly the gap between the previous and current annual record.
那么,是什么原因导致了这种热峰值?大气温室气体水平持续上升,但自2022年以来的额外负荷只能解释进一步变暖约0.02°C的原因。气候科学家提出的其他理论包括2022年1月汤加Hunga Tonga-Hunga Ha’apai火山喷发的沉降物,该火山喷发既有气溶胶的冷却作用,也有平流层水蒸气的变暖作用,以及在预测的太阳活动高峰之前太阳活动的增加。但这些因素最多只能解释百分之几度的变暖(Schoebel,M.R.等人,Geophys.Res.Lett.50,e2023GL104634;2023)。即使考虑到所有合理的解释,2023年的预期年平均气温和观测年平均气温之间的差异仍约为0.2°C,大致相当于先前与现在的年记录之间的差距。
There is one more factor that could be playing a part. In 2020, new regulations required the shipping industry to use cleaner fuels that reduce sulfur emissions. Sulfur compounds in the atmosphere are reflective and influence several properties of clouds, thereby having an overall cooling effect. Preliminary estimates of the impact of these rules show a negligible effect on global mean temperatures — a change of only a few hundredths of a degree. But reliable assessments of aerosol emissions rely on networks of mostly volunteer-driven efforts, and it could be a year or more before the full data from 2023 are available.
还有一个因素可能在起作用。2020年,一些新规则要求航运业使用更清洁的燃料,以减少硫排放。大气中的硫化合物具有反射性,并影响云的某些特性,从而具有整体冷却效果。对这些规则影响的初步估计表明,对全球平均气温的影响可以忽略不计——只有百分之几度的变化。但气溶胶排放的可靠评估依赖于主要由志愿者推动的网络,可能需要一年或更长时间才能获得2023年的完整数据。
This is too long a wait. Better, more nimble data-collection systems are clearly needed. NASA’s PACE mission, which launched in February, is a step in the right direction. In a few months, the satellite should start providing a global assessment of the composition of various aerosol particles in the atmosphere. The data will be invaluable for reducing the substantial aerosol-related uncertainty in climate models. Hindcasts, informed by new data, could also provide insights into last year’s climate events.
这种等待太长了。显然需要更好、更灵活的数据收集系统。美国国家航空航天局的PACE发射任务于2月发射,是朝着正确方向迈出的一步。几个月后,该卫星将开始对大气中各种气溶胶颗粒的成分进行全球评估。这些数据对于减少气候模型中与气溶胶相关的大量不确定性将是非常宝贵的。根据新数据,通过反演还可以提供针对上年度气候事件的见解。
But it seems unlikely that aerosol effects provide anything close to a full answer. In general, the 2023 temperature anomaly has come out of the blue, revealing an unprecedented knowledge gap perhaps for the first time since about 40 years ago, when satellite data began offering modellers an unparalleled, real-time view of Earth’s climate system. If the anomaly does not stabilize by August — a reasonable expectation based on previous El Niño events — then the world will be in uncharted territory. It could imply that a warming planet is already fundamentally altering how the climate system operates, much sooner than scientists had anticipated. It could also mean that statistical inferences based on past events are less reliable than we thought, adding more uncertainty to seasonal predictions of droughts and rainfall patterns.
但气溶胶效应似乎不太可能提供任何接近完整答案的东西。总的来说,2023年的温度异常突然出现,揭示了前所未有的知识差距,这可能是自大约40年前以来的第一次,当时卫星数据开始为建模者提供无与伦比的地球气候系统实时视图。如果异常现象在8月前不能稳定下来—这是基于之前厄尔尼诺事件的合理预期—那么世界将处于未知领域。这可能意味着,地球变暖已经从根本上改变了气候系统的运行方式,比科学家预期的要快得多。这也可能意味着,基于过去事件的统计推断不如我们想象的那么可靠,给干旱和降雨模式的季节性预测增加了更多的不确定性。
Much of the world’s climate is driven by intricate, long-distance links — known as teleconnections — fuelled by sea and atmospheric currents. If their behaviour is in flux or markedly diverging from previous observations, we need to know about such changes in real time. We need answers for why 2023 turned out to be the warmest year in possibly the past 100,000 years. And we need them quickly.
世界气候的大部分是由复杂的远距离联系驱动的,这种联系被称为遥相关,由洋流和大气流推动。如果它们的行为与之前的观察结果不一致或明显不同,我们需要实时了解这些变化。我们需要答案来解释为什么2023年可能是过去10万年中最热的一年。我们很快就需要它们。
https://blog.sciencenet.cn/blog-38693-1428774.html
https://blog.sciencenet.cn/home.php?mod=space&uid=2277&do=blog&id=1428925
最新证据
今年6月为有记录以来最热6月:与太阳黑子峰值对应
||
今年6月为有记录以来最热6月:与太阳黑子峰值对应
杨学祥,杨冬红
欧盟气候监测机构“哥白尼气候变化服务中心”(C3S)星期一(7月8日)表示,上个月是全球有记录来以最热的6月。
据哥白尼的数据,2024年6月的全球平均气温为62华氏度(16.66摄氏度),比该月30年来的平均气温高出1.2华氏度(0.67摄氏度),这打破了2023年所创下的最热6月纪录,而且是哥白尼自1940年有记录以来所有月份中第三高的气温,仅次于去年的7月和8月。
与之对应的的显著变化是,2023年6-7月和2024年6月太阳黑子进入高值时期(见图1)。
相关报道
今年6月为有记录以来最热6月
美国东北部遭遇热浪袭击,一名市民在纽约哈德逊河边的喷泉中纳凉。(2024年6月20日)
欧盟气候监测机构“哥白尼气候变化服务中心”(C3S)星期一(7月8日)表示,上个月是全球有记录来以最热的6月。
自2023年6月以来,每个月的气温皆打破纪录,全球已连续13个月出现前所未有的高温。哥白尼气候变化服务中心主任卡洛·布翁坦波(Carlo Buontempo)表示:“这不仅仅是一个统计上的异常现象,它凸显了我们气候中巨大而持续的变化。”布翁坦波说:“即使这种特定的极端现象在某个时候结束,随着气候继续变暖,我们也必然会看到新的记录被打破。”他补充道,只要人类不断向大气中添加温室气体,这种情况就是“不可避免的”。
据哥白尼的数据,2024年6月的全球平均气温为62华氏度(16.66摄氏度),比该月30年来的平均气温高出1.2华氏度(0.67摄氏度),这打破了2023年所创下的最热6月纪录,而且是哥白尼自1940年有记录以来所有月份中第三高的气温,仅次于去年的7月和8月。
今年上半年,酷热席卷了从印度到沙特阿拉伯、美国和墨西哥的大片区域。与此同时,连绵不断的降雨导致肯尼亚、中国、巴西、阿富汗、俄罗斯和法国发生大规模的洪水,科学家们也将这种现象与全球暖化联系起来。
希腊和加拿大的野火肆虐。上星期,飓风贝里尔(Hurricane Beryl)横扫了几个加勒比岛屿,成为有记录以来最早的五级大西洋飓风。
哥白尼气候变化服务中心高级科学家朱利安·尼古拉斯(Julien Nicolas)表示,创纪录的气温与厄尔尼诺现象(El Nino)同时出现。厄尔尼诺现象是指东太平洋海水每隔数年就会异常升温的现象,因此导致全球气候变暖。尼古拉斯说:“这是气温创纪录的部分因素,但并不是唯一的因素。”此外海洋温度也在创下新高。大西洋、北太平洋和印度洋创纪录的海面温度,也导致全球气温飙升。海面温度在6月份创下另一个里程碑—连续15个月创下新高。尼古拉斯称这一现象“令人震惊”。海洋覆盖了地球表面的70%,吸收了与气候变暖排放增加相关90%的额外热量。尼古拉斯说:“海洋表面的变化对海面气温和全球平均温度有着重要影响。”然而,世界即将进入拉尼娜现象(La Nina),即东太平洋降温阶段,这将产生降温效应。尼古拉斯说:“我们可以预计全球(空气)温度将在未来几个月内会逐渐下降。”他补充道:“如果这些创纪录的(海面)温度持续存在,即使在拉尼娜现象发展的条件下,也可能导致2024年比2023年更热。但现在还言之过早。”
哥白尼气候变化服务中心的数据,截至2024年6月的12个月内,全球气温创下有记录以来的最高水平,平均比工业化前水平高出1.64摄氏度。这并不意味着2015年195个联合国成员国签署的《巴黎协定》提出的1.5摄氏度升温限制已被突破,因为该目标是以数十年为单位来衡量的,而不是以个别年份为单位。但上个月,哥白尼中心表示,未来五年内,地球年平均气温至少有80%的机率会暂时超过1.5摄氏度。
2024年6月太阳黑子日平均为三年来最高值157.1
||
2024年6月太阳黑子日平均为三年来最高值157.1
杨学祥,杨冬红
关键提示
继2022年12月太阳黑子出现110高值之后,2023年1月太阳黑子再次出现高值133.35,但是2023年2月减少,降为130.64,3月更少,降为108.55。4月最少,跌破100,降为88.33,5月回升为125.77,6月达到最大值140.57,7月达到最大值145.26,连续两月创新高。8月急剧下降,为99.87,降幅为45.39。9月升为129.93。10月降为94.94。11月升为105.87。12月为113.65。 2024年1月为121.77。2月为116.68。3月为103.06。4月为141.1,低于2023年7月最高值,符合预期。5月上旬为139.8,低于4月,符合预期。2024年5月太阳黑子日平均为146.26稍高于2023年7月145.26。2024年6月出现新高值157.1。
https://blog.sciencenet.cn/blog-2277-1429657.html
2024年6月太阳黑子最高值不利于新冠病毒的生存、繁殖和传播。
https://blog.sciencenet.cn/home.php?mod=space&uid=2277&do=blog&id=1396747
https://wap.sciencenet.cn/blog-2277-1340989.html
https://blog.sciencenet.cn/home.php?mod=space&uid=2277&do=blog&id=1396734
https://blog.sciencenet.cn/blog-2277-1397110.html
相关图表
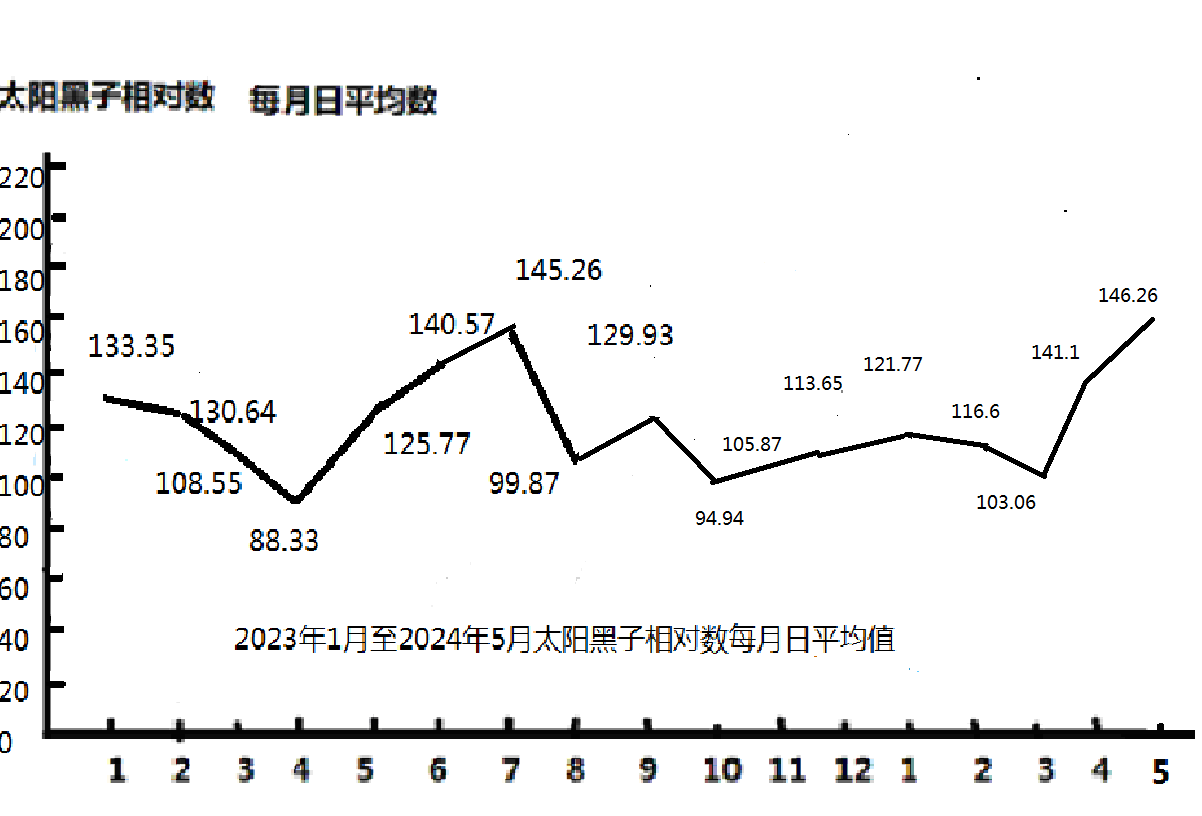
图1 2024年5月太阳黑子日平均第二高值146.26和第三高值145.26
https://blog.sciencenet.cn/blog-2277-1440509.html
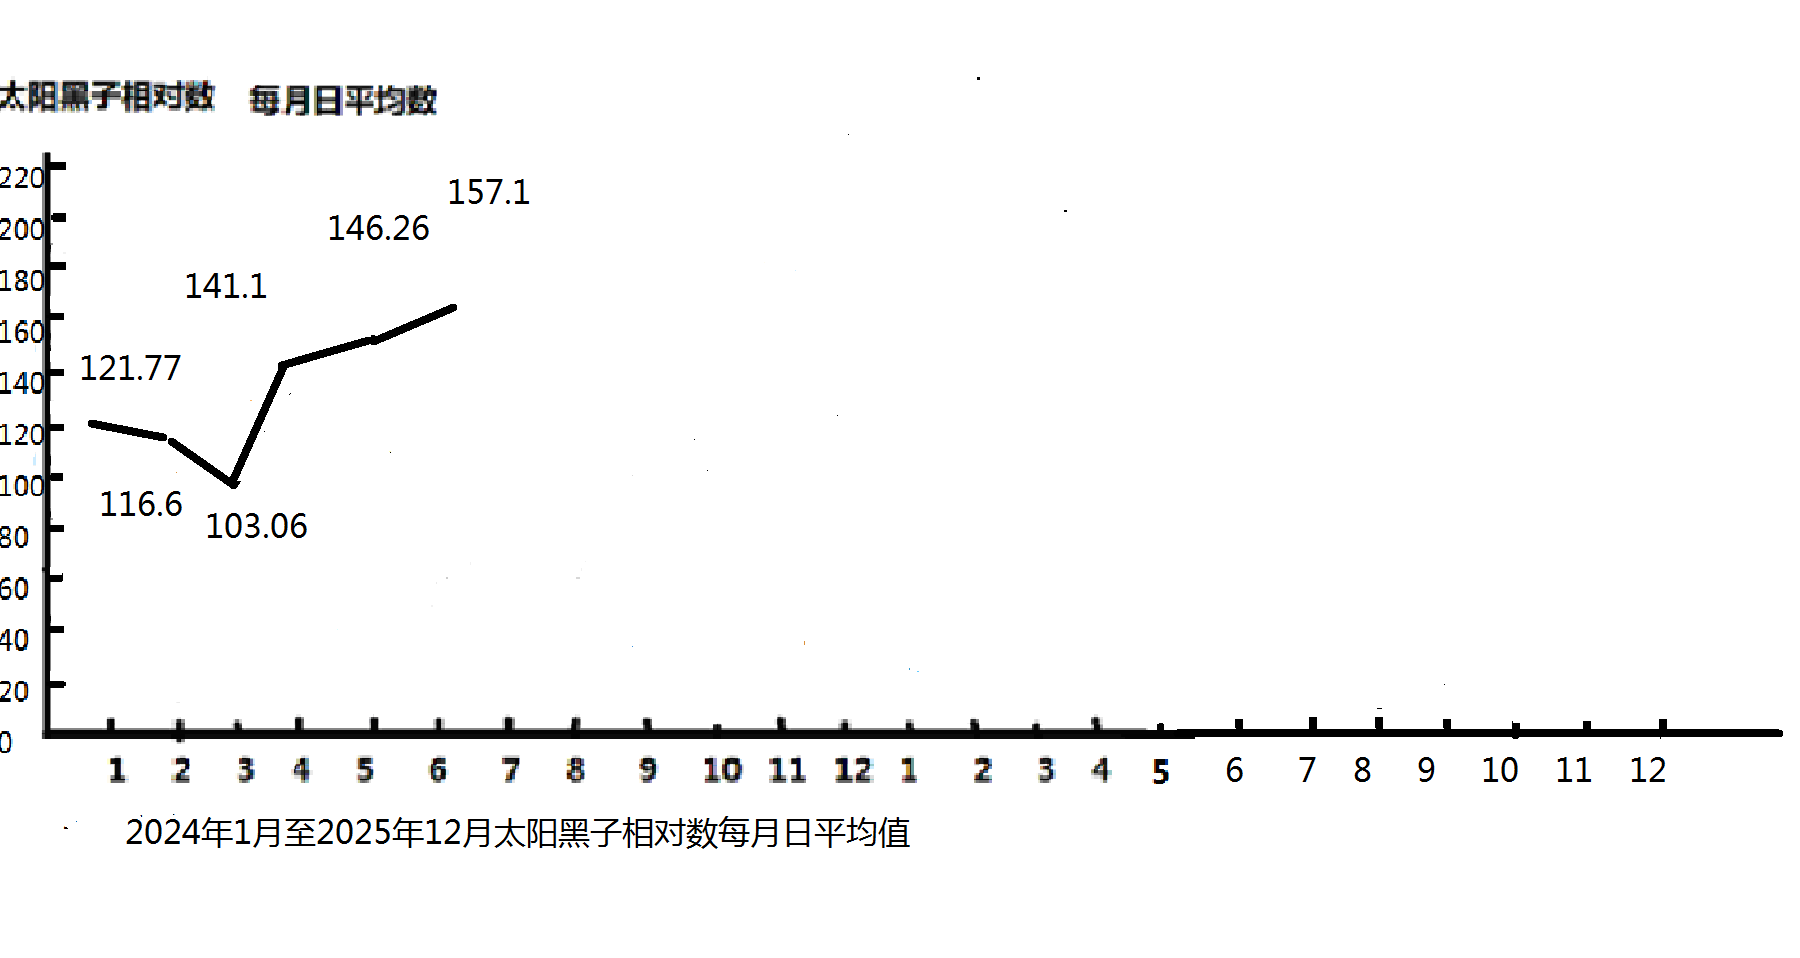
图2 2024年6月太阳黑子日平均第一高值157.1
https://blog.sciencenet.cn/blog-2277-1441524.html
https://blog.sciencenet.cn/blog-2277-1441655.html
上一篇:2024年7月10日早报:太阳黑子下降期和强震使厄尔尼诺指数进入快速下降区间
下一篇:2024年7月10日午报:太阳黑子下降期和强震使厄尔尼诺指数进入快速下降区间