博文
R语言AIS软件包详解--look函数
|||
Micah Altman于2006年写了R语言软件包AIS,包括四个函数DWIMxtabs、look、HTML.DWIMxtabs和 print.DWIMxtabs,利用该软件包可以对数据集进行初步的探索性分析。Agri521翻译了该包的手册,感兴趣的可以到 这里 下载。
本文将以look函数为例进行详细的讲解,并列出统计结果,和大家一同学习,共同进步。
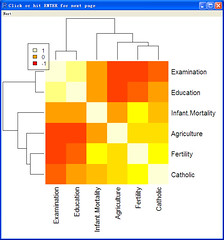
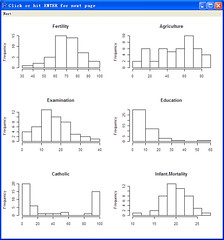
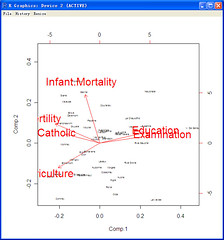
look函数可以对多元结构数据集有个初步的认识,这包括数据集的最大值、最小值、均值、中 位数、百分位数、主成分分析、相关矩阵、相关矩阵热力地图(a heatmap of the correlation matrix)、频数分布图、平行坐标图(parallel coordinates plot)。
代码及结果如下:
> data(swiss) #打开R软件随带的数据集swiss
> swiss #显示数据集swiss,若数据集较大,可以使用head(swiss) ,仅显著部分数据
> library(AIS) #打开AIS包
> fl <- look(swiss) #look函数赋给fl
> print(fl) #输出对象fl
Fertility Agriculture Examination Education
Min. :35.00 Min. : 1.20 Min. : 3.00 Min. : 1.00
1st Qu.:64.70 1st Qu.:35.90 1st Qu.:12.00 1st Qu.: 6.00
Median :70.40 Median :54.10 Median :16.00 Median : 8.00
Mean :70.14 Mean :50.66 Mean :16.49 Mean :10.98
3rd Qu.:78.45 3rd Qu.:67.65 3rd Qu.:22.00 3rd Qu.:12.00
Max. :92.50 Max. :89.70 Max. :37.00 Max. :53.00
Catholic Infant.Mortality
Min. : 2.150 Min. :10.80
1st Qu.: 5.195 1st Qu.:18.15
Median : 15.140 Median :20.00
Mean : 41.144 Mean :19.94
3rd Qu.: 93.125 3rd Qu.:21.70
Max. :100.000 Max. :26.60
Importance of components(成分重要性):
Comp.1 Comp.2 Comp.3 Comp.4 Comp.5
Standard deviation 1.7887865 1.0900955 0.9206573 0.66251693 0.45225403
Proportion of Variance 0.5332928 0.1980514 0.1412683 0.07315478 0.03408895
Cumulative Proportion 0.5332928 0.7313442 0.8726125 0.94576729 0.97985624
Comp.6
Standard deviation 0.34765292
Proportion of Variance 0.02014376
Cumulative Proportion 1.00000000
(相关矩阵)
Fertility Agriculture Examination Education Catholic
Fertility 1.0000000 0.2426643 -0.66090300 -0.44325769 0.41364556
Agriculture 0.2426643 1.0000000 -0.59885994 -0.65046381 0.28868781
Examination -0.6609030 -0.5988599 1.00000000 0.67460383 -0.47505753
Education -0.4432577 -0.6504638 0.67460383 1.00000000 -0.14441631
Catholic 0.4136456 0.2886878 -0.47505753 -0.14441631 1.00000000
Infant.Mortality 0.4371367 -0.1521287 -0.05915436 -0.01898137 0.06611714
Infant.Mortality
Fertility 0.43713670
Agriculture -0.15212866
Examination -0.05915436
Education -0.01898137
Catholic 0.06611714
Infant.Mortality 1.00000000
> plot(fl) #绘制对象fl

# 若需保存图可以使用如下代码
png(filename=”images/look_%03d.png” ,width=480, height=480)
plot(fl)
dev.off()
https://blog.sciencenet.cn/blog-81938-341918.html
上一篇:R语言与通径分析
下一篇:AquaCrop和ETo Calculator 简体中文版