博文
Matlab画柱状图
||
%权当常用程序记录贴
%两种数据对比
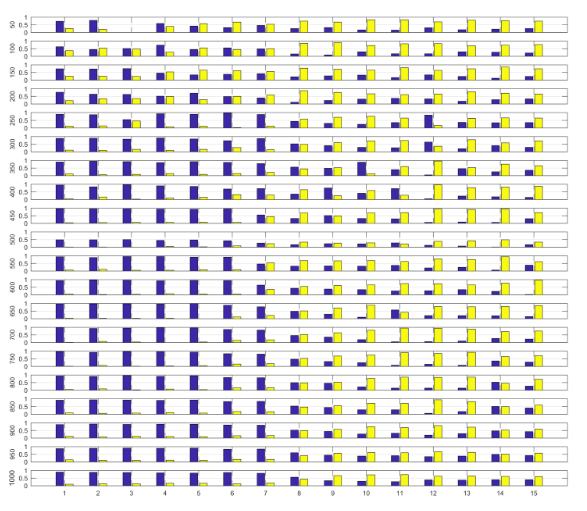
for i=1:20
index1=find(pr==50*i);
index(1:length(index1),i)=index1;
omp_1(i,1:length(index1))=omp(index1,1);
omp_2(i,1:length(index1))=omp(index1,2);
subplot(20,1,i)
y(1:15,1)=omp_1(i,:);y(1:15,2)=omp_2(i,:);
b=bar(y);
grid on;
ch = get(b,'children');
set(gca,'XTickLabel',[],'yticklabel',{'0','0.5','1'},'fontsize',8);
ylabel({num2str(50*i)},'fontsize',8);
end
set(gca,'XTickLabel',{'1','2','3','4','5','6','7','8','9','10','11','12','13','14','15'},'fontsize',8)
%=====================================================
%根据数值调整颜色条
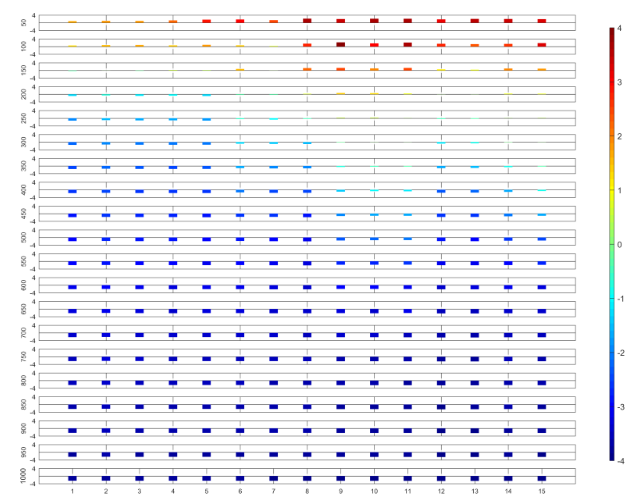
for i=1:20
index1=find(pr==50*i);
index(1:length(index1),i)=index1;
pspi_1(i,1:length(index1))=pspi(index1,1);
subplot(20,1,i)
x=1:15;
n=60;
color1 = colormap(jet(n));
hold on
for j=1:15
ind(i,j) = floor((n-1)*(pspi_1(i,j)+2.5892)/(max(max(pspi_1))+2.5892))+1;
b=bar(x(j),pspi_1(i,j),'edgecolor','none', 'facecolor',color1(ind(i,j),:),'barwidth',0.25);
end
set(gca,'ylim',[-4 4],'yTick',-4:8:4,'XTickLabel',[],'fontsize',8);
ylabel({num2str(50*i)},'fontsize',8);
colormap(color1)
box on
grid on
end
set(gca,'XTick',1:1:15,'XTickLabel',{'1','2','3','4','5','6','7','8','9','10','11','12','13','14','15'},'fontsize',8)
axes('position',[0.9 0.15 0.1 0.75])
axis off;
ax=colorbar('fontsize',10);caxis([-4 4]);
https://blog.sciencenet.cn/blog-3437825-1242955.html