博文
When Structural Biology Meets Art
|
PyMOL and Inkscape Bridge the Data and the Data Visualization
Structural biology has come a long way, from being a niche interest of specialists to where we are today, with over 127,500 biomolecular structures available in the Protein Data Bank (PDB) as of the writing of this letter. The two main factors that have been pushing structural biology forward are the remarkable technical advancements that make solving structures of more complex and larger biomolecules and biomolecular assemblies possible, and the growing appreciation that structure and function are inseparable and intertwined (Ouzounis et al., 2003).
In practical terms, it means that we can look deeper into physiology and biological processes if we have structural information about the key biomolecules involved at the ready (Lee et al., 2007, Yuan et al., 2016a and Yuan et al., 2016b) and if we know how to use this information efficiently. Several years ago, O’Donoghue et al. (2010) put together a powerful argument for the critical role visualization plays in understanding and using macromolecular structures. At the same time, O’Donoghue et al. (2010) highlighted that existing tools routinely used to visualize structural biology information lack elegance and simplicity and often get in the way of helping those not trained in structural biology to interface and interact with three-dimensional (3D) biomolecular structures in an intuitive and seamless manner.
That is not to say that biologists have not been using visualization tools developed over the years (Humphrey et al., 1996, O’Donoghue et al., 2010 and Pettersen et al., 2004) with success. However, many of these tools have some drawbacks; for example, some of them do not support Linux and/or the MacOS platform, some of them do not support Python programming or they use other programming languages that cannot batch multiple tasks in an easy way, some of them suffer from low rendering speed and efficiency, some of them depend heavily on command line and the interfaces that are not user-friendly, and the list can go on and on.
We realize that developing the perfect software that would serve specialists and novices equally well and enable discovery as well as encourage exploration or even play is a difficult task. We also appreciate that there may not be a perfect solution that would tick off all the boxes. Having said that, in this Letter we would like to share our experience working with two visualization tools that to our mind stand apart from the rest as being both easy to use and very versatile. The two tools are PyMOL and Inkscape, and in our hand, using the two together makes a real difference to how easily we can generate visualization for our structural biology information, and how well and how clearly these images represent our data (http://crosstalk.cell.com/blog/an-easy-way-to-visualize-structural-biology-data).
movie 1. Adding a protonated hydrogen atom to the serotonin molecule in PyMol.
PyMOL (http://www.pymol.org) is a user-friendly tool (Schrodinger, 2015) that works across all platforms including Linux, MacOS, and Windows. It has been widely used in visualizing macromolecules (Miller et al., 2015). Most tasks of rendering or representations could be done by clicking the mouse or selecting from the menu. PyMOL is a Python-based tool, and many Python plugins have been developed to enhance the visualization and even molecular modeling. These features facilitate batching multiple jobs simultaneously. Users could also take advantage of Python, the most popular scripting language, to render their system in a more sophisticated way. Moreover, the high quality rendering in PyMOL is supported by parallel processing with multiple CPUs, which dramatically boosts the performance of generating the high quality images. On top of it, users can specify an appropriate amount of memory for the rendering so that PyMOL does not occupy too many hardware resources. Furthermore, PyMOL supports a command line, which is of great help in handling multiple objects.
We would like to point out that in addition to being an accurate representation of complex structural biology data, these images should also have a high esthetic value and convey not only the sense of science, space, and functionality, but the sense of elegance. PyMOL and similar tools create accurate and workable images; however, additional work is needed to get the most out of data visualization in structural biology and here vector drawing tools are invaluable. There are many good vector drawing tools available, and we would like to highlight Inkscape (http://www.inkscape.org), a free vector graphics software of professional quality. Inkscape supports all platforms including Linux, MacOS, and Windows. The remarkable attribute of Inkscape is its use of scalable vector graphics (SVG), an open XML-based W3C standard, as the native format (Minatani, 2015). Inkscape can render primitive vector shapes (such as rectangles, ellipses, polygons, arcs, spirals, stars, and isometric boxes), text, and regions containing raster graphics. It also supports image tracing, enabling the editor to create vector graphics from photos and other raster sources. Inkscape can easily export high resolution images in various formats including cairo PNG (.png), portable document format (.pdf), postscript (.ps), HTML5 canvas (.html), and so on. Command line options for exporting and conversions make Inkscape more efficient in handling a large number of tasks in parallel.
movie 2. Preparing the 2D/3D hybrid protein-ligand interaction diagram in Inkscape.
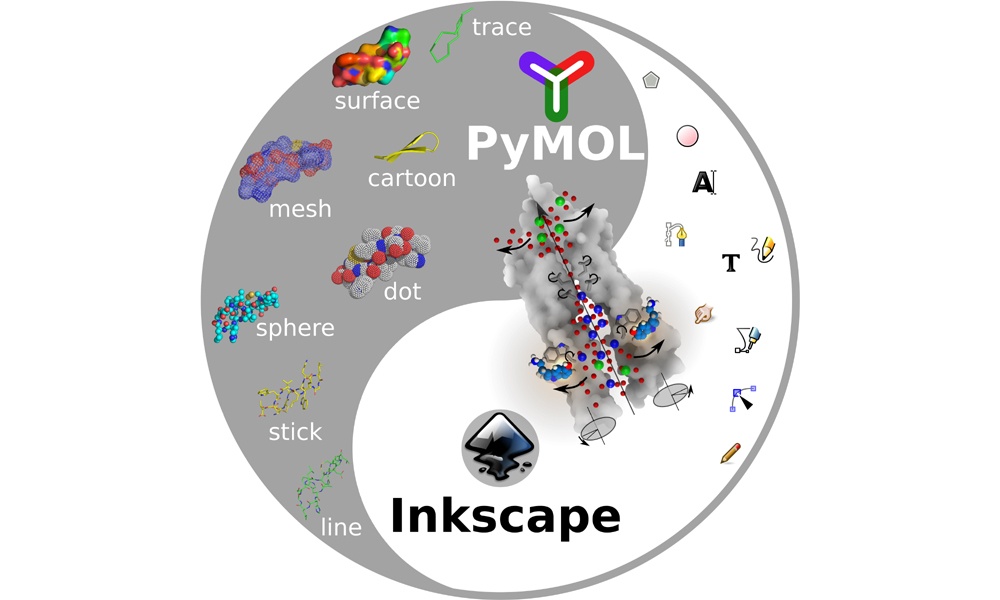
In our hands, we found that combining PyMOL and Inkscape allows for easy and efficient presentation of structural biology data in a clear, professional, and artistic way. One can first create each component (such as cartoons, surfaces, ball-and-sticks, meshes, and so on) for illustration in PyMOL, then assemble them in Inkscape by lines, ellipses, curves, texts, and so on. You can see some examples of our images in the blog post accompanying this letter (http://crosstalk.cell.com/blog/an-easy-way-to-visualize-structural-biology-data).
In conclusion, PyMOL is a dedicated tool for macromolecular visualization, whereas Inkscape is a vector software of professional quality. Using PyMOL and Inkscape together provides an easy and elegant way of visualizing structural biology information. PyMOL and Inkscape bridge the data and the data visualization.
movie 3. Preparing the lipid bilayer for the 5-HT3R activation scheme in Inkscape.
https://blog.sciencenet.cn/blog-355217-1019166.html
上一篇:Find our missing file browser panel back
下一篇:Pharmacology: Inside-out receptor inhibition