博文
GEE -- 遥感影像预处理
||
使用GEE进行影像如下预处理:
Extract image projection information and reproject an image. 重投影
Register images. 校准影像
Remove shadows. 去除阴影
Remove clouds. 去除云
Compute spectral indices. 计算光谱指数
Image Projections 投影
寻找投影信息
//Finding image projection information
var image = ee.Image('LANDSAT/LT05/C01/T1_TOA/LT05_015030_20100531');
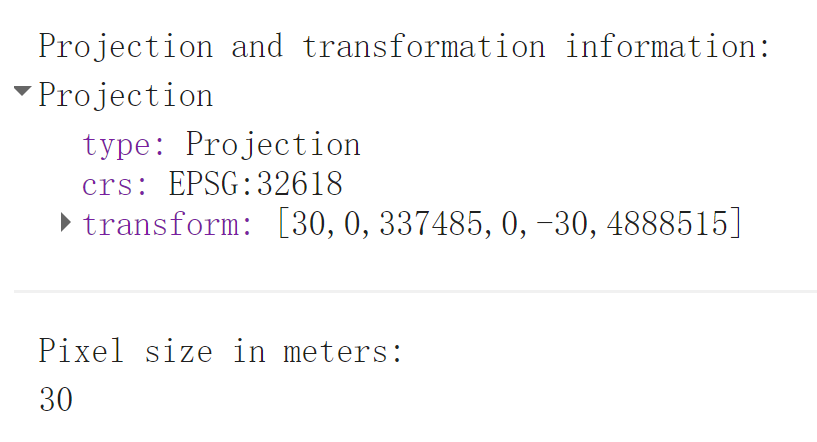
print('Projection and transformation information:', image.projection());
//Print the nominal pixel size of the image (in meters) at the lowest level of the image pyramid
print('Pixel size in meters:', image.projection().nominalScale());
//Confirm that the nominal pixel size for the Landsat image is 30m
重投影
var image = ee.Image('MODIS/MOD13A1/MOD13A1_005_2014_05_09');
print(image.projection()); //Confirm that the CRS is SR-ORG:6974 (a sinusoidal projection)
var visParams = {min: 0.15, max: 0.7}; //Define visualization parameters
Map.setCenter(-77.5127,43.2642,11); //Zoom to location near Rochester at level 11
Map.addLayer(image, visParams, 'original'); //Add the original image to the map.
var reprojected = image .reproject('EPSG:4326'); //EPSG:4326 is the code for ellipsoidal coordinates based on WGS 84
Map.addLayer(reprojected, visParams, 'Reprojected');
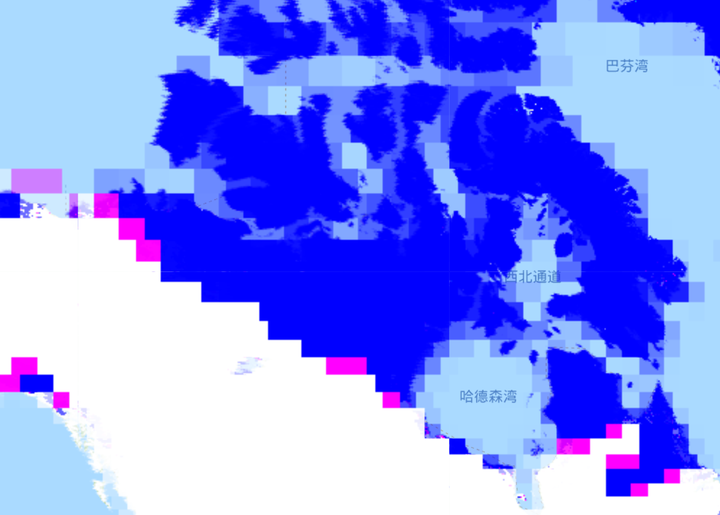
重投影后分辨率变为100km左右了
Performing image registration 影像校准
将来自不同传感器、具有不同获取时间、视场的数据校准到一个相同共有的地理空间参考系
/* There are two steps to registering an image in GEE:
determining a displacement image, which contains bands dx and dy that show an offset in x and y,
respectively for each pixel, and then applying this to the image that is to be registered.
This can be performed as two separate steps (Approach 1 below) or as a single step (Approach 2).*/
// Load two images to be registered.
var image1 = ee.Image('SKYSAT/GEN-A/PUBLIC/ORTHO/MULTISPECTRAL/s01_20150502T082736Z');
var image2 = ee.Image('SKYSAT/GEN-A/PUBLIC/ORTHO/MULTISPECTRAL/s01_20150305T081019Z');
//Resampling in GEE can use nearest neighbor, bilinear or bicubic interpolation
var image1Orig = image1.resample('bicubic'); //This forces the resampling method to bicubic
var image2Orig = image2.resample('bicubic'); //Without using resample, the default is nearest neighbor
//Choose to register using only the 'R' band.
var image1RedBand = image1Orig.select('R'); //Create a new image that contains only the red band
var image2RedBand = image2Orig.select('R');
//Approach 1
//Determine the displacement needed to register image2 to image1 (using the selected red bands).
var displacement = image2RedBand.displacement({
referenceImage: image1RedBand,
maxOffset: 50.0, //defines the maximum displacement between the two images
patchWidth: 100.0 //size of patch used to determine image offsets.
});
// Use the computed displacement to register all original bands.
var registered = image2Orig.displace(displacement);
// Show the results of co-registering the images.
var visParams = {bands: ['R', 'G', 'B'], max: 4000};
Map.addLayer(image1Orig, visParams, 'Reference');
Map.addLayer(image2Orig, visParams, 'Before Registration');
//Map.addLayer(registered, visParams, 'After Registration');//error! 可注释
//Approach 2
/*If you don't need to know what the displacement is, Earth Engine provides the register() method, which combines calls to displacement() and displace().
The register() function uses all bands of the image in performing the registration. */
var alsoRegistered = image2Orig.register({
referenceImage: image1Orig,
maxOffset: 50.0,
patchWidth: 100.0 });
//Map.addLayer(alsoRegistered, visParams, 'Also Registered');
探测并去除阴影像元(2 种方法)
有不同的颜色模型或颜色空间,例如 Red-Green-Glue (RGB), Hue-Saturation-Value (HSV), C1C2C3 等。
方法1
使用 C3* 指数, 基于 C1C2C3 颜色模型. Besher and Abdelhafiz (2015) found that the C3 component was sensitive to shadows but was not stable for certain color values. Thus, the C3* index was introduced to include near-infrared (NIR) information to increase the stability of the original C3 index. A threshold value is then used to distinguish between shadow and non-shadow pixels based on a histogram of C3* values. If water features are present in the image, a water mask is also applied since water and shadow pixels have similar radiometric responses.
方法2
Approach 2 utilizes the HSV color space and applies the normalized saturation-value difference index (NSVDI). A threshold value is used to distinguish between shadow and non-shadow based on a histogram of NSDVI values.
Mostafa and Abdelhafiz (2017) describe these two approaches as the best approaches in shadow detection due to the use of direct formula, and an automatic procedure that does not require human input.
具体操作实现
首先选择兴趣点与影像,准备好RGBN波段
/*Define study boundary and name it as geometry. This is a necessary step to limit the study boundary to the image of interest.*/
var geometry = ee.Geometry.Polygon(
[[[-76.1397, 43.0399],
[-76.1399, 43.0314],
[-76.1283, 43.0314],
[-76.1284, 43.0397]]]);
//Create a variable called NAIP to point to the NAIP data collection
var NAIP = ee.ImageCollection('USDA/NAIP/DOQQ'); //Filter NAIP imagery
var point = ee.Geometry.Point(-76.136, 43.036); //Create a point at City of Syracuse
var naipImage = NAIP
.filterBounds(point) //filter with defined filter location
.filterDate('2011-01-01','2011-12-30') //Limit images to the ones collected in 2011
.mosaic(); //Convert selected images into one composite image rather than an image collection.
Map.setCenter(-76.1362, 43.0362, 15);
Map.addLayer(naipImage,{},'original NAIP image');
print(naipImage)
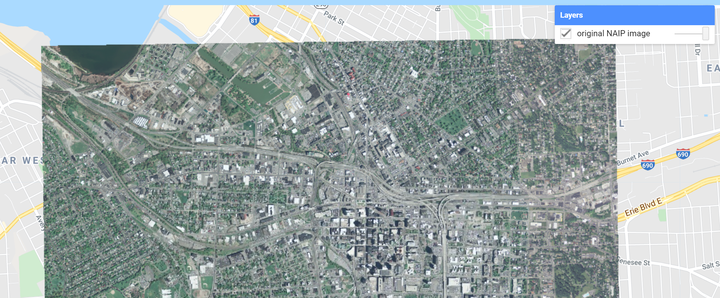
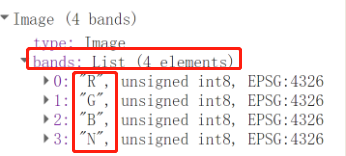
Approach 1: Modified C3* Index (from Besheer and Abdelhafiz, 2015).
//Construct an image with green, red and near infrared bands of selected NAIP image
var imageGRN = naipImage.select(['G','R','N']);
/*Spatial reducers are functions in GEE that composite all the images in an Image Collection to a single image representing, for example, the min, max, mean or standard deviation of the images.
It can also be used to composite the maximum value per each pixel across all bands in one image.
Here, it reduce the GRN image to a one-band image with the maximum DN value for each pixel across all bands in the GRN image.*/
var maxValue = imageGRN.reduce(ee.Reducer.max());
// Merge the one-band maximum value image and the original NAIP image to create a new image.
var imageMAX = naipImage.addBands(maxValue.select(['max']),["max"]);
/*first max selects the band to add, second max provides the name of the band in the new image*/
// Calculate C3* index (from Besheer and Abdelhafiz, 2015)
var C3 = imageMAX.expression(
'atan(B/max)', {
'B':imageMAX.select('B'),
'max':imageMAX.select('max')
});
print(C3)
/* Print a histogram of the C3* index and determine the inflection point.
Besheer and Abdelhafiz (2015) found experimentally that selecting the low frequency DN
in the valley between the predominant features gave consistently accurate threshold levels
for separating the shadow from non-shadow regions. See Figure 2 in Besheer and Abdelhafiz (2015) for more details. */
//阈值的选取在优势特征之间的谷中选择低DN
print(ui.Chart.image.histogram(C3,geometry,1));
//Based on selected threshold above, mask out non-shadow from the C3 image
var shadowmask = C3.select('B').gte(0.85);
//create non-shadow mask based on C3 threshold
var C3shadow = C3.updateMask(shadowmask);
//apply mask C3 image to get shadow-only image
// Apply a NDWI mask to the shadow image to mitigate confusion between water and shadows.
// Generate a NDWI image based on the selected NAIP image bands
var NDWI = imageMAX.expression(
'(G-N)/(G+N)', {
'G':imageMAX.select('G'),
'N':imageMAX.select('N')
});
// Print a histogram of the NDWI values and determine low point in the last valley.
print(ui.Chart.image.histogram(NDWI,geometry,1));
// Based on the threshold selected above, mask out water pixels from the shadow-only C3 image
var NDWImask = NDWI.select('G').lte(0.6);
//create a water mask based on selected threshold in step above
var C3shadow = C3shadow.updateMask(NDWImask);
//apply defined mask from above to the shadow-only C3 index image
//Display final shadow pixels with water removed.
//This sets the stage for shadow compensation, which is the next key step in shadow detection and removal. Shadow compensation can be done by applying equation 17 in Mostafa and Abdelhafiz (2017).
Map.addLayer(C3shadow, {palette: 'FF0000'}, 'shadow_final');

C3*指数阈值选取,谷值

NDWI阈值选取:最后一个谷值处
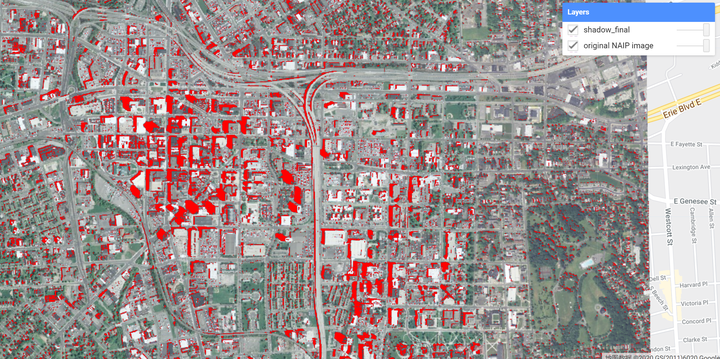
红色为阴影
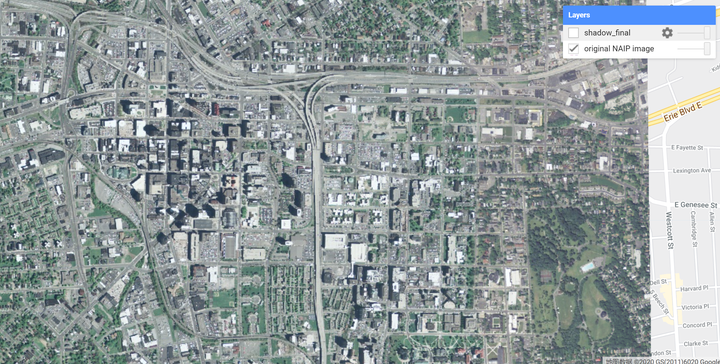
原始图像
Approach 2: Normalized saturation-value difference index (NSVDI) (from Mostafa and Abdelhafiz, 2017).
var naipImage = naipImage
.select(['R','G','B'])
.divide(255);
/*Convert NAIP image into Hue-Saturation-Value (HSV) space.
HSV space is also referred to as IHS (intensity, hue, saturation) or HSB
(hue, saturation, brightness). HSV system is an alternative to describing colors
using RGB components. Value relates to the brightness of a color.
Hue refers to the dominant wavelength of light contributing to the color.
Saturation specifies the purity of color relative to gray.
It is often utilized in operations for resolution-enhancement (Lillesand et al. 2015). */
var naipImagehsv = naipImage.rgbToHsv();
var NSVDI = naipImagehsv.expression(
'(S-V)/(S+V)', {
'S':naipImagehsv.select('saturation'),
'V':naipImagehsv.select('value')
});
/*Print a histogram of the NSVDI in order to determine the shadow threshold.
Mostafa and Abdelhafiz (2017) expect the threshold to be zero,
but this did not provide a satisfactory result.
An iterative process was needed to identify a threshold (-0.2). */
print(ui.Chart.image.histogram(NSVDI,geometry,1));
var NSVDImask = NSVDI.select('saturation').gte(-0.2); //select non-shadow pixels based
var NSVDIshadow = NSVDI.updateMask(NSVDImask); //apply mask to remove non-shadow pixels.
// Display the shadow-only NSVDI image
Map.addLayer(NSVDIshadow,{palette: 'FF0000'});

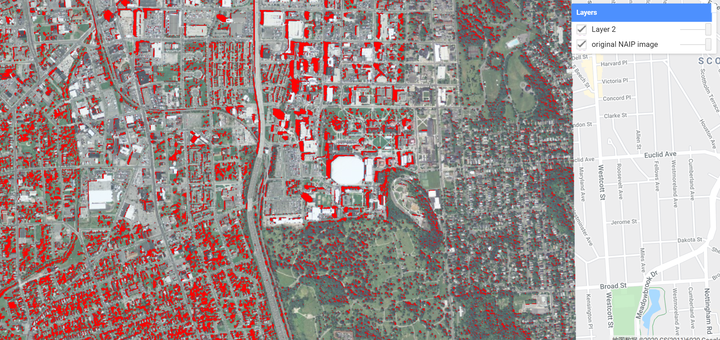
Cloud detection 云探测
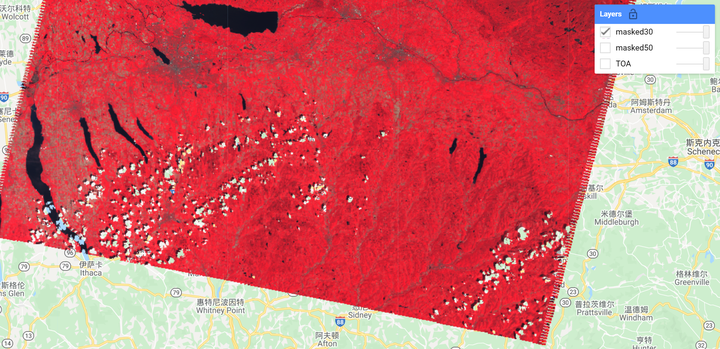
This section explores the detection of cloud pixels utilizing the built-in Landsat cloud score function in GEE that compute a score of cloudiness for each pixel. Note that cloud detection is a first step in compensating for the impact of cloudy pixels.
var cloudy_scene = ee.Image('LANDSAT/LT05/C01/T1_TOA/LT05_015030_20100531');
Map.centerObject(cloudy_scene);
Map.addLayer(cloudy_scene, {bands: ['B4', 'B3', 'B2'], max: 0.4}, 'TOA');
/* Add the cloud score band, which is automatically called 'cloud'.
The simpleCloudScore function uses brightness, temperature, and NDSI to compute a score
in the range [0,100]. */
var scored = ee.Algorithms.Landsat.simpleCloudScore(cloudy_scene);
/* Create a mask from the cloud score by experimentally selecting a threshold.
Smaller thresholds mean more pixels are selected as clouds. */
var mask50 = scored.select(['cloud']).lte(50); // selects pixels with cloud score of 50 or less
var mask30 = scored.select(['cloud']).lte(30);
// Apply the masks created above to the image and display the result to determine an appropriate threshold.
var masked50 = cloudy_scene.updateMask(mask50); //apply mask50
Map.addLayer(masked50, {bands: ['B4', 'B3', 'B2'], max: 0.4}, 'masked50');
var masked30 = cloudy_scene.updateMask(mask30); //apply mask30
Map.addLayer(masked30, {bands: ['B4', 'B3', 'B2'], max: 0.4}, 'masked30');
光谱指数计算
// Load an image.
var image = ee.Image('LANDSAT/LT05/C01/T1_TOA/LT05_015030_20100531');
var evi = CF.expression(
'2.5 * ((NIR - RED) / (NIR + 6 * RED - 7.5 * BLUE + 1))',{
'NIR':image.select('B4'), //select 4th band
'RED':image.select('B3'), //select 3rd band
'BLUE':image.select('B1') //select 1st band
});
Map.addLayer(evi);
【参考】
lab教程
![]() Lab 2 – Image preprocessing techniques using Google Earth Engine.pdf
Lab 2 – Image preprocessing techniques using Google Earth Engine.pdf
https://drive.google.com/file/d/1VV4Zq39y4yo8MHCQIg0ECikUoLIDxQ2l/viewdrive.google.com
Besheer, M., Abdelhafiz, A., 2015. Modified invariant colour model for shadow detection. Int. J. Remote Sens. 36, 6214–6223. Modified invariant colour model for shadow detection.
Mostafa, Y., Abdelhafiz, A., 2017. Accurate shadow detection from high-resolution satellite images. IEEE Geoscience and Remote Sensing Letters. 14, 494–498. https://doi.org/10.1109/LGRS.2017.2650996.
Scaramuzza, P.L., Bouchard, M.A., Dwyer, J.L., 2012. Development of the Landsat data continuity mission cloud-cover assessment algorithms. IEEE Trans. Geosci. Remote Sens. 50, 1140–1154. Development of the Landsat Data Continuity Mission Cloud-Cover Assessment Algorithms.
Zitová, B., Flusser, J., 2003. Image registration methods: A survey. Image Vis. Comput. 21, 977–1000. https://doi.org/10.1016/S0262-8856(03)00137-9.
重建NDVI序列影像
Chen, J., Jönsson, P., Tamura, M., Gu, Z., Matsushita, B., Eklundh, L., 2004. A simple method for reconstructing a high-quality NDVI time-series data set based on the Savitzky-Golay filter. Remote Sens. Environ. 91, 332–344. doi:10.1016/j.rse.2004.03.014
Harris Geospatial, 2018. Spectral Indices. URL 这是一个光谱指数大集合
http://www.harrisgeospatial.com/docs/alphabeticallistspectralindices.htmlwww.harrisgeospatial.com
Horning, N., 2004. Selecting the appropriate band combination for an RGB image using Landsat imagery Version 1.0. American Museum of Natural History, Center for Biodiversity and Conservation.
https://www.amnh.org/content/download/74355/1391463/file/SelectingAppropriateBwww.amnh.org
andCombinations_Final.pdf (accessed 25 Feb 2018)
Kennedy M., 2000. Understanding Map Projections. GIS by ESRI 1–31.
http://www.icsm.gov.au/mapping/images/Understanding_Map_Projections.pdfwww.icsm.gov.au
Lillesand, T. M., Kiefer, R. W., & Chipman, J. W. (2015). Remote sensing and image interpretation. 7th edition. John Wiley & Sons.
https://zhuanlan.zhihu.com/p/148472010
点滴分享,福泽你我!Add oil!
https://blog.sciencenet.cn/blog-3428464-1241440.html
上一篇:GEE -- 影像分类(1)
下一篇:GEE -- 遥感数字图像处理
全部作者的其他最新博文
- • [转载]太阳同步轨道
- • 膳食指南