博文
Development Of A New Type Aarray InductionLogging Tool
|||
Bao Dezhou Zhang Xinyun
(China Petroleum Logging company, Ltd.)
ABSTRACT: Imaging logging technology plays a key role in complex and heterogeneous reservoir exploration. In the imaging log families, the array induction imaging log has outstanding effects in the comprehensive interpretation of oil zones featured with low resistivity, which effectively determines the oil saturation of reservoir, and quantitatively describes the invasion profile of drilling fluid, thus catches more and more log interpreters’eye.
This paper briefly introduces the technological and methodological features of a newly developed array induction imaging logging tool (MIT), and outlines the digital composite technology, borehole environmental correction and field tests of the tool. Based on comparative analysis with the same kind tools of other companies in numerous wells in northern
Key words: MIT array introduction, imaging logging, technological structure, field test, applicative analysis
INTRODUCTION
With the development of computer technology, modeling focused introduction logging tool is evolving forward to digitalization and array. In the 90s of 20th century, several world class logging companies introduced array introduction imaging logging tools one after another. The new technology greatly enhanced traditional introduction logging tool, not only improving the vertical resolution and the quantitative description of formation radial heterogeneous invasion, but also simplifying coil manufacturing technique, broadening the tool dynamic range, meanwhile improving logging efficiency[1].
Array introduction imaging logging tool is a new generation of digital and array logging tool, which have the detector with array coil system and adopt multiple frequencies for real time data acquisition. The measurement provides the real and imaginary components of formation conductivity which is processed to obtain the resistivity curves with multiple vertical resolutions and investigation depths. The technology is mainly applied to describe formation bedding and mud invasion, delineate permeable oil/gas layer, compute formation resistivity for oil saturation computation, provide visual 2 dimensional image for the comprehensive interpretation of complex and heterogeneous formation.
During the ninth five year plan, China National Petroleum Corporation (CNPC) organized and conducted the research and development of the array induction imaging logging technology, and the developed array introduction imaging logging tool (MIT) was tested in oil fields. This paper discusses the features of the MIT method and technological structure, and introduces the test and application of MIT, and analyzes the points for attention in the data processing and interpretation in hostile borehole situations
MIT TECHNOLOGICAL STRUCTURE
The MIT system consists of surface processing modulus, software and downhole tool. The modulus include telemetry module and data decoding module, and the software includes field logging software, composition software, and borehole correction, calibration and image processing software. The downhole tools include CTS telemetry sub, power sub, data acquisition sub, prime amplifier sub, coil system sub, pressure balance sub, transmitter circuit sub. The tool specification is as follow:
measurement range 0.1-2000 ohmm
accuracy ±0.75mS/ or < 2%
vertical resolution 30、60、
investigation depth 25、50、75、150、
temperature
logging speed
MIT tool circuits include multiple frequency transmitter, prime amplifier with low noise and broadband, band filter, program-controlled gain amplifier, data acquisition phase geophone, sequence control circuits, DTB, second class calibration circuit, auxiliary measurement circuit, and power circuit. The data processing adopts new generation of DSP technology, and the acquisition module consists one main DSP, three cub-DSPs, four A/D acquisition channels, downhole tool bus interface DTB and auxiliary measurement channel. The main DSP is for uploading all programs, controlling for three sub-DSP and exchanging data, and realize the DTB control of downhole tool, the order receiving identification, playbacked data organization. Four A/D acquisition channel control, PGA control, real time phase geophone and digital filtering are realized from DSP1 to DSP2
MIT transmitter sub consists of transmitting wave circuit, switch control circuit, high pressure filtering and current sampling circuit. Receiver sub consists of four receiver amplifying channels, logic controlling board, secondary calibration board. The real time two level calibration technology is utilized for removing the analog circuit gain and the phase shift caused by environment temperature change. The receiver prime amplifying circuit is a circuit with small signal, low noise and wide frequency band., which consists of low noise unit gain buffer circuit, low noise amplifier circuit, volt amplifier circuit, feedback circuit, temperature compensation circuit and highly accurate power. The power sub offers direct current for the MIT tool. For the tool stability, several measurement are taken, such as separating digital and analog circuits, transmitter and receiver circuits, small signal and large signal
The coil system uses the earthquake proof composite pipe as a supporting house. A fine adjustment unit with a adjustment of 0~
MIT LOG SIGNAL COMPOSITION AND CORRECTION
Digital Composition And Processing
Although array introduction logging tool obtains rich information from downhole formation, it would not offer useful data for log interpretation without processing. That is quite different from traditional introduction log. So, the signal composition processing, which includes the determination of effective background conductivity, true resolution signal composition and resolution match, is the core of MIT array introduction imaging logging technology. The design of the true resolution composition filter is crucial, and the determination of effective background conductivity is necessary for adaptive compositing processing of real nonlinear signal[2].
To analyze tool response and verify the effectiveness of signal composition processing, the tool response must be computed in various geological conditions[3]. We developed a 3D finite element software for hole offcenter computation, and a 2D finite element computing and pattern matching software for radial and vertical multiple layers. Numerical modeling calculation is a tool not only for verification of signal composition, but also for interpretation of log anomaly, which is the basement for inversion[4].
According to the physical theory of introduction logging, the resolution is decreasing with the increasing of depth. The MIT processing introduces the concept of true resolution composition for reducing false information while compositing signal. The deeper the investigation depth is, and the lower the vertical resolution is. Based on borehole correction, the true resolution composition simultaneously corrects skin effect and environment effects by adaptive nonlinear algorithm from calculation of effective conductivity.
For mud invasion analysis, following the true resolution composition, the resolutions with different investigation depths are matched, obtaining three sets of resolution matched curves(0.3、0.6 and
The design of signal composition filter is based on geometrical factor theory of homogeneous formation. Because of heterogeneity of real formation and the nonlinearity of measurement signal, the determination of background conductivity at depth and the realization of nonlinear processing are crucial of software development. Divide conductivity range into multiple segment, and design corresponding filters, and thus build filter library. Establish the relation between conductivity geometrical factor in different background and measurement signal, design filter library separating background conductivity from measurement signal. In real signal processing, the adaptive calculation is used for calculating background conductivity of sub-array signals, and weight the sub-background conductivities for effective background conductivity which is leveraged for the adaptive composition processing of nonlinear signal[5].
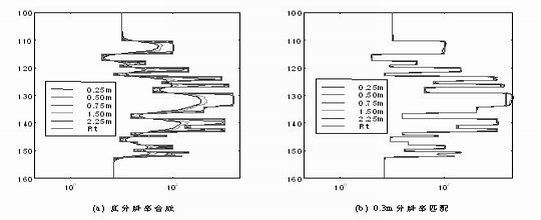
The optimization theory is utilized to build true resolution compositing filter library, resolution matched filter library and apparent background conductivity calculating library. A lot of simulated formations were processed, and good results were reached. Figure 1 is the processed result of

Figure1 composition result of
1. Borehole Environment Correction
The MIT tool adopts three basic coil arrays, and the space between the main transmitter and main receiver is ranging from
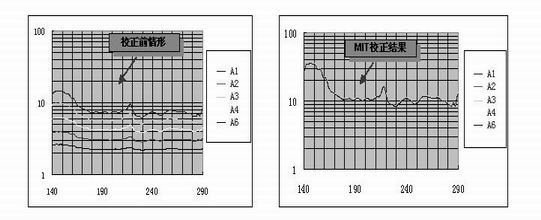
There are four parameters reflecting borehole environment characteristics: mud conductivity Rm, borehole diameter R, the distance X from the tool to the hole wall, and formation resistivity Rt. Forward modeling was conducted in a large range for each parameter in order to correct borehole effects. The results were fitted as a multinomial, a algorithm for quick calculating log response of each original measurement. During logging, these data is quickly inversed, the least square method is utilized to match model data with short array signal to give a optimum model value. That is the measured borehole response. Finally, the log response is subtracted by borehole effects to obtain the measurement with no borehole effects[7]. Figure 2 is the corrected result of a heterogeneous formation with no invasion. The borehole effects resulted in separated cures, and the curves was superimposed after the correction processing.

Figure 2 borehole corrected simulated response of heterogeneous formation
MIT TOOL FIELD TEST AND COMPARISON
The MIT array introduction logging tool was run in 12 wells in Jining, Huabei, Changqing oilfields for repeatability, consistency and logging speed tests, and acquired a series of test data. The log results were compared with conventional introduction tool, Halliburton’ High Resolution Array Introduction tool (HRAI) and Atlas’ High Definition Introduction Logging (HDIL). The 12 well, including 9 exploration wells, one test well and 2 standard wells, is from 80 meters to 3000 meters in depth. A plenty of oil layers and water layers were discovered in the 9 exploration wells.
1. MIT Log Data Comparison With That From The Same Kind Of Foreign Tools
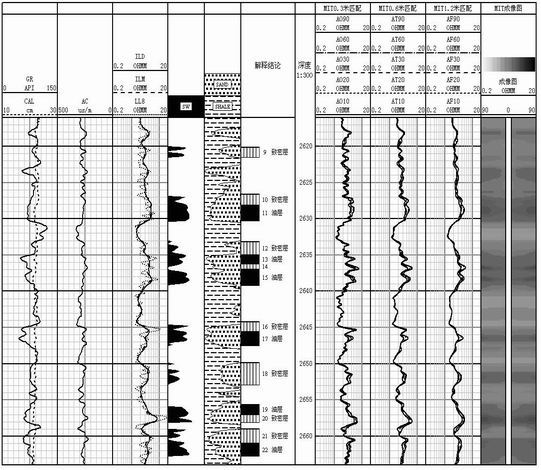
The MIT log data was compared with that from the same kind of foreign tools in three wells, two for HDIL, one for HRAI. Overall, the test data from the three kind of tools is consistent of curve shape, invasion delineation and measurement. In the term of invasion description, the three tools describe invasion, and the MIT tool showed a typical water layer comparing with HDIL in a depth (figure 3),and the MIT data described a difficult layer as a invaded layer, but the HRAI tool indicated no invasion. In the term of thin-bed analysis, the three kinds of tools all showed thin beds with one inch of resolution, and could analyze heterogeneous thin beds in good borehole environment and geological condition. The inversion of investigation depth matched curves can offer accurate true resistivity (Rt) for oil saturation (So) computation. Figure 3 is the MIT log comparison with HDIL log data.

Figure 3 MIT log comparison with that from HDIL
2. MIT Log Comparison With That From Conventional Tool
The MIT log comparison with that from conventional tool showed that the MIT tool identifies and analyzes thin bed throuth resolution matched curves. The data from Qiang ×× well indicated shaly sand and calcareous sand of 20

Figure 4 MIT log comparison with that from conventional introduction tool
3. Thin-Bed Analysis
The
The test in the 12 wells demonstrates that the MIT tool acquires good test data, and that the development and method are reasonable, feasible and reliable. The processing of array introduction log data provides radial resistivity images with three vertical resolutions, five investigation depths, visually describing invasion and determining the properties of oil/water layer. The curves with multiple vertical resolution is capable of formation division, the

Figure 5 MIT response to thin interbed
MIT LOG INTERPRETATION AND ANALYSIS UNDER SPECIAL CONDITIONS
1.Thin Bed Analysis Jointing With Borehole Condition
The tool specifications show that the tool can differentiate layer of
2.Invasion Analysis Against Conductivity Contrast
The MIT curves have shallow and deep investigations, which can delineate invasion in most case. Occasionally, the curves give erroneous interpretation. In high salinity wells, in one hand, mud conductivity produces strong borehole signal due to high contrast between formation and mud conductivity, leading large error in borehole correction, thus under-correction or over-correction. In the other hand, short array measurement units need large correction, and long arrays need small correction, resulting in separation of curves with different investigation depths in homogeneous formation, and small amplitude difference in heterogeneous formation, even no way to correct borehole effect in the formation with low surrounding rock. In shallow thin bed deeply invaded, the shallow investigation curves may read low. When invasion is less
3.Differences Between Array Introduction Log And Conventional Introduction Data Interpretation
Log interpreter is accustomed to interpreting conventional resistivity curve. The comparison with the conventional curves shows the differences between the two kind of introduction tools except for a common usage to delineate invasion. In addition, the MIT array introduction tool characterizes invasion annulus, but the dual introduction-microsphere log or dual introduction-8 lateral log dose not have the ability. In deep invaded formation, the shallow measurement from array introduction tool is also different with microsphere log data.
4.Aapplication Of Numerical Simulation To Fine Interpretation
In fine log interpretation, numerical simulation is a effective method for the special phenomenon mentioned above in addition to interpreter’s experience. Generally, for some problem formation or key layer, the numerical simulation is leveraged for diagnosis. Design corresponding formation model based on log data, and compute response of array introduction and conventional introduction tools, respectively, and analyze these response for reasonable interpretation. The introduction logging method utilizes calculation technologies to theorize and simulate reality. So the array measurements is deviated from real value. In log interpretation, the coincidence rate of interpretation can be improved through fine data processing, proper numerical simulation and experience accumulation. In addition, the interpretation and application can be enhanced by environment correction such as offcenter correction and dip correction, and perfect inversion.
CONCLUSION
The MIT tool developed by CNPC offers composition curves with three vertical resolutions and five investigations, and the relevant data processing method and software were are been developed. The overall performance of the tool meets design demand. The downhole tool utilizes a new generation of DSP processing technology for high acquisition accuracy. New materials and new technology are adopted for the design of coil system, resulting in to convenient adjustment.
The creative points is the MIT data processing and software, the optimum design of composition focused filter coefficients, the nonlinear adaptive composition method and the adaptive borehole correction. Field test and application in plenty of wells demonstrate that the tool is valuable of real application. The log data acquired by the tool can be used to differentiate thin bed, delineate formation heterogeneity, quantitatively describe bedding and invasion, determine formation resistivity. The log data is consistent to that from foreign tools. This project is rank third in the board of
The author is appreciative of professor Wujie’s careful and patient examination and revision. The members engaged in the project include Mr.Xie Shuqi, Mr.Wang Zheng, Mr.Zhu Jun, Mr.Zhou Jun, Mr.Wang Chenglong, Mr.Chen Jianghao, Mr.Liu Xiangzheng, Mr.Li Miaoxiao, Mr.Li Xigang, Mr.Chen Tao, Mr.Zhang Qunhua, Mr.Ying Zhaoming, Mr.Ruan Yijun.
REFERENCE
[1] Tian Zili et al., Theory and Application of Introduction Logging.
[2] Wu Jie, et al., Theory And Application Of Electric Logging.
[3] Anderson,B.,and Gianzero,S. Induction Sonde Response in Stratified Media, The Log Analyst,Jan.-Feb.,1983
[4] Chang,S.K.,and
[5] Yuan Yaxiang. Numerical Method Nonlinear Projection. Shanghai: Shanghai Science Pess,1993
[6] Huang,M.,and Pai,D.M.,“Mathematical Modeling of Borebole and Bed Boundary Effects in Induction Logging”,SEG 56th,1986.
[7] G.P.Grove,and G.N.Minerbo. An Adaptive Borebole Correction Scheme for Array Induction Tools, SPLWA 32th Annual Logging Symposium, 1991
https://blog.sciencenet.cn/blog-293094-284532.html
上一篇:成功者的素质
下一篇:意识运动定律
全部作者的精选博文
- • 张掖七彩丹霞地貌
- • 大漠风光
- • 美丽的希拉穆仁大草原