博文
matplotlib画直方图实例
||
源代码如下:
import numpy as np
import matplotlib.pyplot as plt
plt.rcParams['font.sans-serif']=['SimHei']
def auto_text(rects,ax):
for rect in rects:
ax.text(rect.get_x()+bar_with/2, rect.get_height(), rect.get_height(), ha='center', va='bottom',fontsize=8)
plt.figure(figsize=(10, 6)) # 设置画布
ax1 = plt.subplot(311)
x_index = np.arange(3) # 确定label的位置
x_data = ("10分钟", "30分钟", "60分钟")
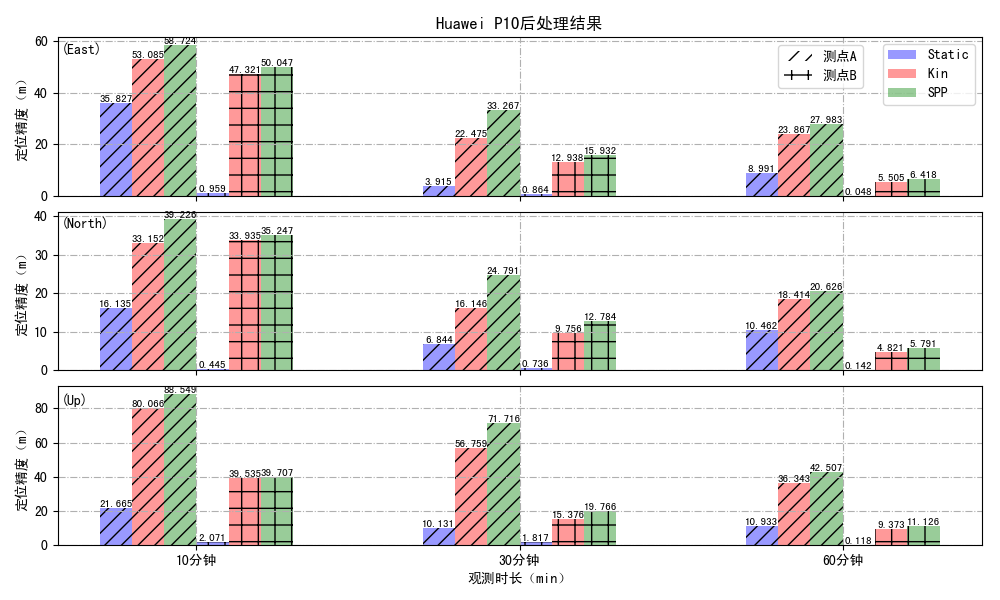
y1_data = (35.827, 3.915, 8.991)
y2_data = (53.085, 22.475, 23.867)
y3_data = (58.724, 33.267, 27.983)
y4_data = (0.959, 0.864, 0.048)
y5_data = (47.321, 12.938, 5.505)
y6_data = (50.047, 15.932, 6.418)
bar_with = 0.1 # 定义一个数字代表独立柱的宽度
ad = 0.4 # alpha数值
rects1 = plt.bar(x_index-2*bar_with, y1_data, width=bar_with, alpha=ad, hatch='//', color="b", label="Static")
rects2 = plt.bar(x_index-bar_with, y2_data, width=bar_with, alpha=ad, hatch='//', color="r", label="Kin")
rects3 = plt.bar(x_index, y3_data, width=bar_with, alpha=ad, hatch='//', color="g", label="SPP")
auto_text(rects1,ax1)
auto_text(rects2,ax1)
auto_text(rects3,ax1)
rects4 = plt.bar(x_index+bar_with, y4_data, width=bar_with, alpha=ad, hatch='+', color="b")
rects5 = plt.bar(x_index+2*bar_with, y5_data, width=bar_with, alpha=ad, hatch='+', color="r")
rects6 = plt.bar(x_index+3*bar_with, y6_data, width=bar_with, alpha=ad, hatch='+', color="g")
auto_text(rects4,ax1)
auto_text(rects5,ax1)
auto_text(rects6,ax1)
plt.xticks(x_index + bar_with/2, x_data) # 设定x轴
plt.setp(ax1.get_xticklabels(), visible=False)
rects_Static = plt.bar(0, 0, width=0, alpha=ad, color="b")
rects_Kin = plt.bar(0, 0, width=0, alpha=ad, color="r")
rects_SPP = plt.bar(0, 0, width=0, alpha=ad, color="g")
legend_rectsA = plt.bar(0, 0, width=0, alpha=ad, hatch='//', color="w")
legend_rectsB = plt.bar(0, 0, width=0, alpha=ad, hatch='+', color="w")
leg1=plt.legend([rects_Static,rects_Kin,rects_SPP], ['Static', 'Kin', 'SPP']) # 显示图例
from matplotlib.legend import Legend
leg2 = Legend(ax1, [legend_rectsA,legend_rectsB], ['测点A', '测点B'], loc=(0.78,0.68))
ax1.add_artist(leg2)
plt.title('Huawei P10后处理结果')
# plt.grid(axis="y")
plt.grid(ls='-.') # 绘制背景线
plt.ylabel("定位精度(m)")
ax1.text(rects1[0].get_x()-1.2*bar_with, 55, '(East)', fontsize=10)
plt.tight_layout()
#----------------分隔行--------------------
ax2 = plt.subplot(312)
x_index = np.arange(3) # 确定label的位置
x_data = ("10分钟", "30分钟", "60分钟")
y1_data = (16.135, 6.844, 10.462)
y2_data = (33.152, 16.146, 18.414)
y3_data = (39.226, 24.791, 20.626)
y4_data = (0.445, 0.736, 0.142)
y5_data = (33.935, 9.756, 4.821)
y6_data = (35.247, 12.784, 5.791)
bar_with = 0.1 # 定义一个数字代表独立柱的宽度
ad = 0.4 # alpha数值
rects1 = plt.bar(x_index-2*bar_with, y1_data, width=bar_with, alpha=ad, hatch='//', color="b", label="Static")
rects2 = plt.bar(x_index-bar_with, y2_data, width=bar_with, alpha=ad, hatch='//', color="r", label="Kin")
rects3 = plt.bar(x_index, y3_data, width=bar_with, alpha=ad, hatch='//', color="g", label="SPP")
auto_text(rects1,ax2)
auto_text(rects2,ax2)
auto_text(rects3,ax2)
ad = 0.4 # alpha数值
rects4 = plt.bar(x_index+bar_with, y4_data, width=bar_with, alpha=ad, hatch='+', color="b")
rects5 = plt.bar(x_index+2*bar_with, y5_data, width=bar_with, alpha=ad, hatch='+', color="r")
rects6 = plt.bar(x_index+3*bar_with, y6_data, width=bar_with, alpha=ad, hatch='+', color="g")
auto_text(rects4,ax2)
auto_text(rects5,ax2)
auto_text(rects6,ax2)
plt.xticks(x_index + bar_with /2, x_data) # 设定x轴
plt.setp(ax2.get_xticklabels(), visible=False)
# plt.grid(axis="y")
plt.grid(ls='-.') # 绘制背景线
plt.ylabel("定位精度(m)")
ax2.text(rects1[0].get_x()-1.2*bar_with, 37, '(North)', fontsize=10)
plt.tight_layout()
#----------------分隔行--------------------
ax3 = plt.subplot(313)
x_index = np.arange(3) # 确定label的位置
x_data = ("10分钟", "30分钟", "60分钟")
y1_data = (21.665, 10.131, 10.933)
y2_data = (80.066, 56.759, 36.343)
y3_data = (88.549, 71.716, 42.507)
y4_data = (2.071, 1.817, 0.118)
y5_data = (39.535, 15.376, 9.373)
y6_data = (39.707, 19.766, 11.126)
bar_with = 0.1 # 定义一个数字代表独立柱的宽度
ad = 0.4 # alpha数值
rects1 = plt.bar(x_index-2*bar_with, y1_data, width=bar_with, alpha=ad, hatch='//', color="b", label="Static")
rects2 = plt.bar(x_index-bar_with, y2_data, width=bar_with, alpha=ad, hatch='//', color="r", label="Kin")
rects3 = plt.bar(x_index, y3_data, width=bar_with, alpha=ad, hatch='//', color="g", label="SPP")
auto_text(rects1,ax3)
auto_text(rects2,ax3)
auto_text(rects3,ax3)
ad = 0.4 # alpha数值
rects4 = plt.bar(x_index+bar_with, y4_data, width=bar_with, alpha=ad, hatch='+', color="b")
rects5 = plt.bar(x_index+2*bar_with, y5_data, width=bar_with, alpha=ad, hatch='+', color="r")
rects6 = plt.bar(x_index+3*bar_with, y6_data, width=bar_with, alpha=ad, hatch='+', color="g")
auto_text(rects4,ax3)
auto_text(rects5,ax3)
auto_text(rects6,ax3)
plt.xticks(x_index + bar_with /2, x_data) # 设定x轴
# plt.grid(axis="y")
plt.grid(ls='-.') # 绘制背景线
plt.xlabel("观测时长(min)")
plt.ylabel("定位精度(m)")
ax3.text(rects1[0].get_x()-1.2*bar_with, 82, '(Up)', fontsize=10)
plt.tight_layout() #自动调整子图间距,使得图形显示正常
plt.subplots_adjust(wspace =0, hspace =0.1)#调整子图间距
#plt.get_current_fig_manager().window.state('zoomed') # 调整figure最大化显示
plt.savefig('Huawei P10 后处理结果.pdf')
plt.savefig('Huawei P10 后处理结果.png')
plt.show()
https://blog.sciencenet.cn/blog-858128-1273957.html
上一篇:解决xlabel显示不全
下一篇:【Shell】echo不显示变量中的多个空格