博文
Python里面给数据点不同颜色不对称的横纵误差棒
||
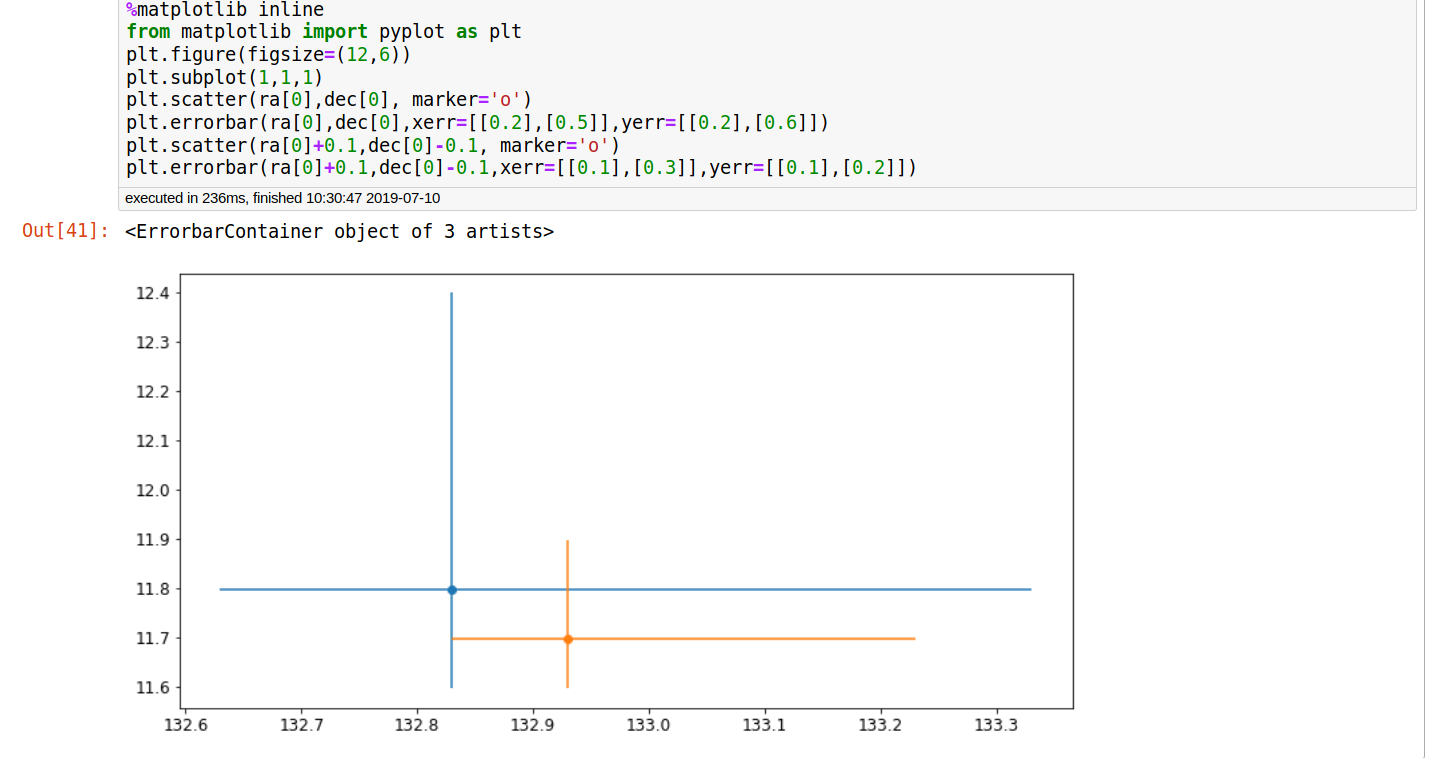
eg1:
eg2:
x1=mux1_mcmc[0]
y1=muy1_mcmc[0]
x2=mux2_mcmc[0]
y2=muy2_mcmc[0]
x1err=sigmax1_mcmc[0]
y1err=sigmay1_mcmc[0]
x2err=sigmax2_mcmc[0]
y2err=sigmay2_mcmc[0]
x=samplers[:,0]
y=samplers[:,1]
print(len(x))
print(np.min(x),np.max(x),np.min(y),np.max(y))
left, width = 0.1, 0.65
bottom, height = 0.1, 0.65
spacing = 0.005
rect_scatter = [left, bottom, width, height]
rect_histx = [left, bottom + height + spacing, width, 0.2]
rect_histy = [left + width + spacing, bottom, 0.2, height]
# start with a rectangular Figure
plt.figure(figsize=(8, 8))
ax_scatter = plt.axes(rect_scatter)
ax_scatter.tick_params(direction='in', top=True, right=True)
ax_histx = plt.axes(rect_histx)
ax_histx.tick_params(direction='in', labelbottom=False)
ax_histy = plt.axes(rect_histy)
ax_histy.tick_params(direction='in', labelleft=False)
#####################################################################
# the scatter plot:
ax_scatter.scatter(x, y)
axs0=plt.axes(rect_scatter)
axs0.plot(x1,y1,'r-')
axs0.errorbar(x1, y1, xerr=x1err,yerr=y1err,alpha=1.0,markersize=3,fmt='ro')
axs0.plot(x2,y2,'b-')
axs0.errorbar(x2, y2, xerr=x2err,yerr=y2err,alpha=1.0,markersize=3,fmt='bo')
binsx=30
binsy=30
ax_histx.hist(x, bins=binsx)
ax_histy.hist(y, bins=binsy, orientation='horizontal')
plt.savefig("test.png")
plt.show()
https://blog.sciencenet.cn/blog-587102-1188874.html
上一篇:[转载]pycharm代码整体左移和右移缩进快捷键
下一篇:ubuntu18.04 install anaconda