博文
双摆的MATLAB程序模拟
|
关于双摆的介绍,见维基百科。
https://en.wikipedia.org/wiki/Double_pendulum
双摆随着时间的运动关系可用微分方程组来刻画,
先上图
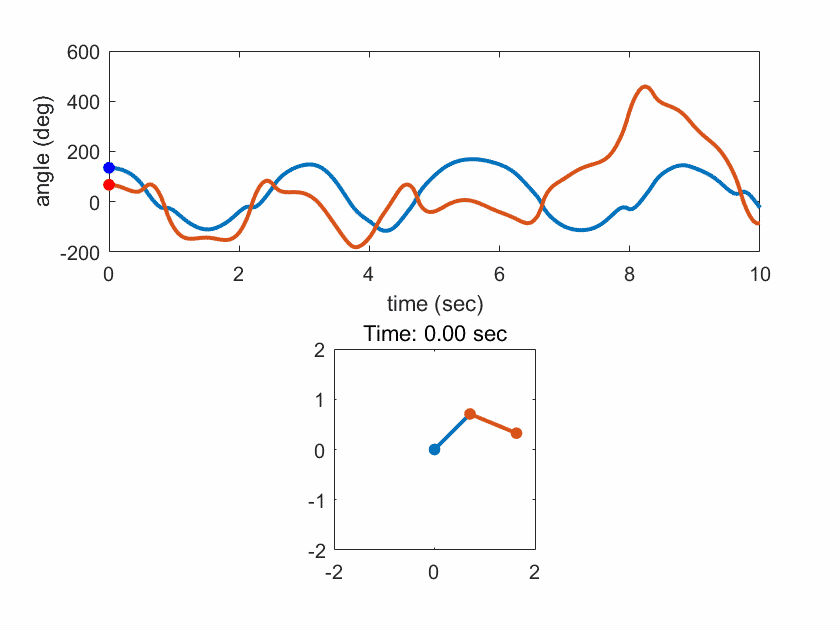
MATLAB程序为
function dy = double_pendulum(t, y, m, L)
% System of ODEs for a double pendulum (mass m and link length L)
% See http://en.wikipedia.org/wiki/Double_pendulum for the differential equations
g = 9.81;
theta1 = y(1); % angle 1
theta2 = y(2); % angle 2
p1 = y(3); % momentum
p2 = y(4); % momentum
% The derivatives
dy(1) = 6/(m*L^2) * (2*p1-3*cos(theta1-theta2)*p2) / ...
(16-9*cos(theta1-theta2)^2);
dy(2) = 6/(m*L^2)*(8*p2-3*cos(theta1-theta2)*p1) / ...
(16-9*cos(theta1-theta2)^2);
dy(3) = -1/2*m*L^2*(dy(1)*dy(2)*sin(theta1-theta2)+3*g/L*sin(theta1));
dy(4) = -1/2*m*L^2*(-dy(1)*dy(2)*sin(theta1-theta2)+g/L*sin(theta2));
dy = dy(:);
主程序
m = 1;
L = 1;
theta1 = 3*pi/4;
theta2 = 3*pi/8;
t = linspace(0, 10, 200);
% Solving ODE of a double pendulum
[T,Y] = ode45(@(t, x) double_pendulum(t, x, m, L), ...
t, [theta1, theta2, 0, 0]);
% Calculating joint coordinates for animation purposes
x = [L*sin(Y(:,1)), L*sin(Y(:,1))+L*sin(Y(:,2))];
y = [-L*cos(Y(:,1)), -L*cos(Y(:,1))-L*cos(Y(:,2))];
% Convert radians to degrees
ang = Y(:,1:2)*180/pi;
% Set up first frame
figure('Color', 'white')
subplot(2,1,1)
plot(T, ang, 'LineWidth', 2)
hh1(1) = line(T(1), ang(1,1), 'Marker', '.', 'MarkerSize', 20, ...
'Color', 'b');
hh1(2) = line(T(1), ang(1,2), 'Marker', '.', 'MarkerSize', 20, ...
'Color', 'r');
xlabel('time (sec)')
ylabel('angle (deg)')
subplot(2,1,2)
hh2 = plot([0, x(1,1);x(1,1), x(1,2)], [0, y(1,1);y(1,1), y(1,2)], ...
'.-', 'MarkerSize', 20, 'LineWidth', 2);
axis equal
axis([-2*L 2*L -2*L 2*L])
ht = title(sprintf('Time: %0.2f sec', T(1)));
% Get figure size
pos = get(gcf, 'Position');
width = pos(3);
height = pos(4);
% Preallocate data (for storing frame data)
mov = zeros(height, width, 1, length(T));%, 'uint8');
% Loop through by changing XData and YData
for id = 1:length(T)
% Update graphics data. This is more efficient than recreating plots.
set(hh1(1), 'XData', T(id), 'YData', ang(id, 1))
set(hh1(2), 'XData', T(id), 'YData', ang(id, 2))
set(hh2(1), 'XData', [0, x(id, 1)], 'YData', [0, y(id, 1)])
set(hh2(2), 'XData', x(id, :), 'YData', y(id, :))
set(ht, 'String', sprintf('Time: %0.2f sec', T(id)))
%下面输出 gif 动画
frame=getframe(gcf);
im=frame2im(frame);%制作gif文件,图像必须是index索引图像
[I,map]=rgb2ind(im,20);
if id ==1
imwrite(I,map,'doublependulumanimation.gif','gif', 'Loopcount',inf,'DelayTime',0.5);%第一次必须创建!
else
imwrite(I,map,'doublependulumanimation.gif','gif','WriteMode','append','DelayTime',0.5);
end
end
https://blog.sciencenet.cn/blog-292361-1038664.html
上一篇:地球数学物理方程学生手册
下一篇:2017年考研数学题目与解析