博文
【MATLAB】嵌套坐标的相关设置
|||
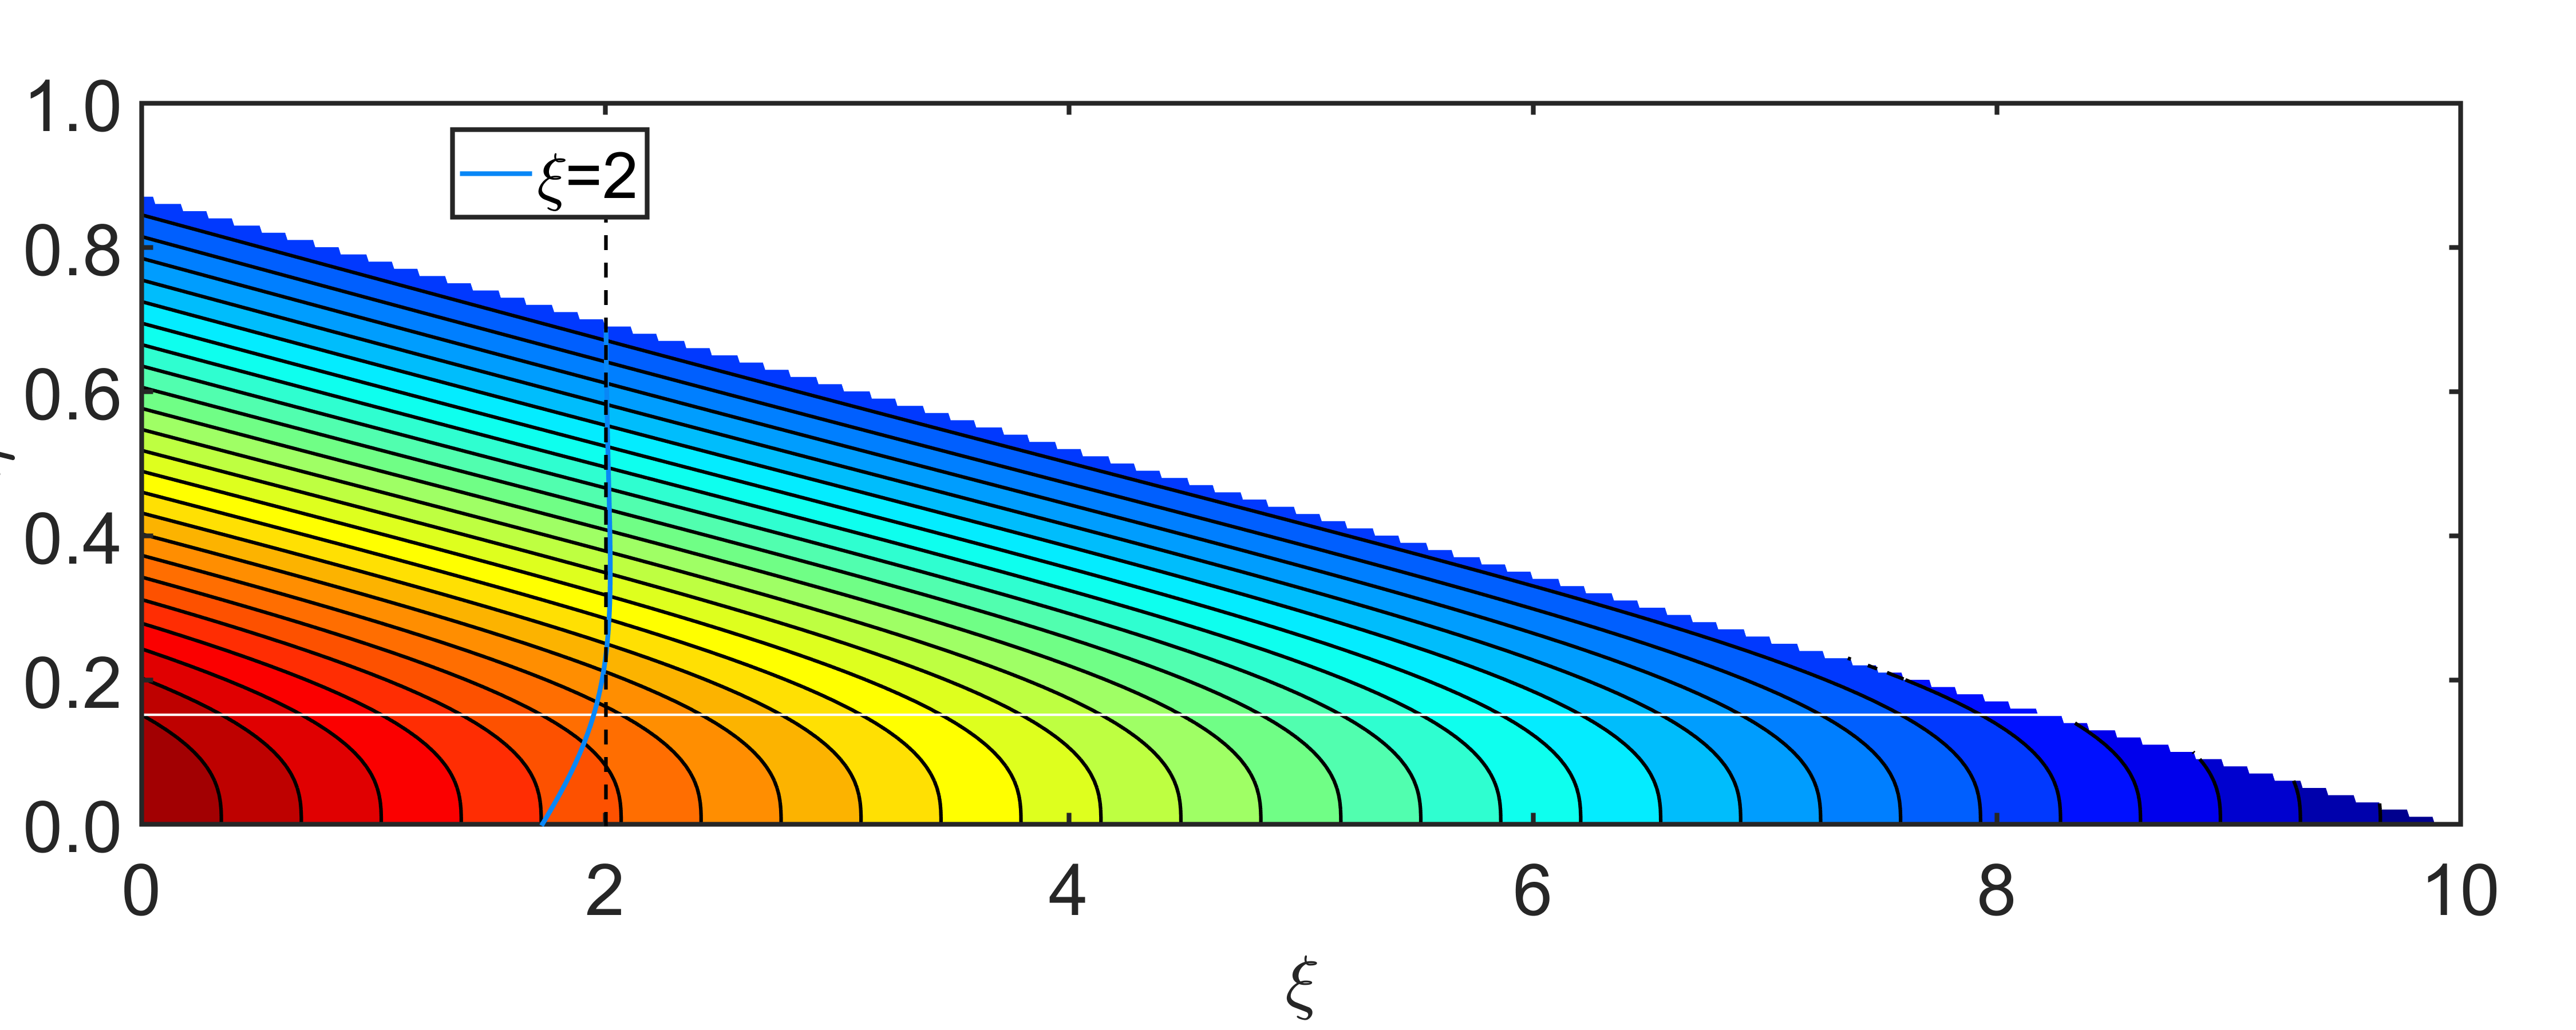
在大的背景下添加相关坐标
close all;figure('position',[50 100 1850 900],'color','w')
axes('position',[0.055 0.2 0.9 0.7])
itv=linspace(min(rho_xi_eta(:)),max(rho_xi_eta(:)),30);
contourf(xi,eta,rho_xi_eta,itv,'edgecolor','none')
hold on;
contour(xi,eta,rho_xi_eta,itv,'k-','linewidth',1.5)
......
% 添加坐标
aa=get(gca,'position');
h1=axes('position',[0.5 aa(2) 0.05 aa(end)]);
set(h1,'color','none') %设置透明背景
set(gca,'ycolor','none') %隐藏y轴
set(gca,'xcolor','none') %隐藏x轴
box off;
colorseq=mycolor.color94;
color_str=colorseq(1:70:end,:);
for nn=2
hold on;
ii=find(xi(1,:)==nn);
h1=plot(f_eta(:,ii),eta(:,ii),'color',color_str(nn+1,:),'linewidth',2);
end
legend('\xi=2')
h=line([0 0],[0 0.9],'color','k');
set(h,'linestyle','--','linewidth',1.5)
set(get(get(h,'Annotation'),'LegendInformation'),'IconDisplayStyle','off'); %设置不显示这条线的legend
xlim([-1.5 1.5]*1e-8)
set(gca,'xtick',[-10:5:5]*1e-9)
h1=line([-10 5]*1e-9,[delta delta],'color','k');
set(h1,'linestyle','--','linewidth',1.5)
set(get(get(h1,'Annotation'),'LegendInformation'),'IconDisplayStyle','off');
ylim([0 1])

https://blog.sciencenet.cn/blog-2824237-1109619.html
上一篇:【MATLAB】fopen和eval结合应用实例
下一篇:【Endnote】引用文献杂志名称的缩写问题