博文
Glutathione fluorescent probe and surgery-guide in cancer
|
Bioimaging of Glutathione with a Two-Photon Fluorescent Probe and Its Potential Application for Surgery Guide in Laryngeal Cancer
Yuxia Zou【邹玉霞】,#†‡ Mingshun Li【李明顺】,#† Yanlong Xing【邢艳珑】,†* Tingting Duan【段婷婷】,‡ Xuejun Zhou【周学军】,†‡* Fabiao Yu【于法标】†‡*
† Institute of Functional Materials and Molecular Imaging, Key Laboratory of Emergency and Trauma, Ministry of Education, Key Laboratory of Hainan Trauma and Disaster Rescue, College of Clinical Medicine, College of Emergency and Trauma, Hainan Medical University, Haikou 571199, China
‡ Department of Otolaryngology, Head and Neck Surgery, the First Affiliated Hospital of Hainan Medical University, Haikou 570102, China
KEYWORDS: fluorescent probes; two-photon; glutathione; cell imaging; in vivo imaging; laryngeal cancer.
https://pubs.acs.org/doi/10.1021/acssensors.9b02118
ABSTRACT: As the most abundant non-protein biothiol in living cells, glutathione (GSH) prevents cellular components from oxidative damage and maintains the intracellular redox homeostasis. For further exploring whether GSH can be employed as a bio-indicator to discriminate tumor lesion at cellular level, the highly selective detection and accurate quantification of GSH under pathological conditions are critical. Herein, we design a coumarin derivative-based two-photon fluorescent probe Cou-Br for the detection of GSH in living cells, in mice models, and in clinical specimens. The prepared probe is capable of sensitively and selectively detecting GSH in complex biological systems. Cou-Br displays a good linear relationship in response to GSH and a low limit of detection. With the fluorescence signal positively associated with intracellular GSH levels, the probe enables real-time imaging of GSH in various cell lines. Under the condition of CS2 stimulation, Cou-Br can rapidly respond to the fluctuation of intracellular GSH induced by oxidative damage. Furthermore, the in situ and in vivo bioimaging performances of Cou-Br are demonstrated both in vitro and in vivo. Typically, relying on the different cellular concentrations of GSH, the probe is successfully employed to identify the human laryngeal cancer lesion with outstanding capabilities of deep tissue imaging and tumor margin recognition. We assume that the abnormal expression level of GSH may be utilized as a potential bio-indicator to discriminate tumor tissues from the surrounding disease-free tissues. To conclude, the proposed probe Cou-Br may potentially serve as a powerful chemical tool for the surgical navigation of cancer in clinic.
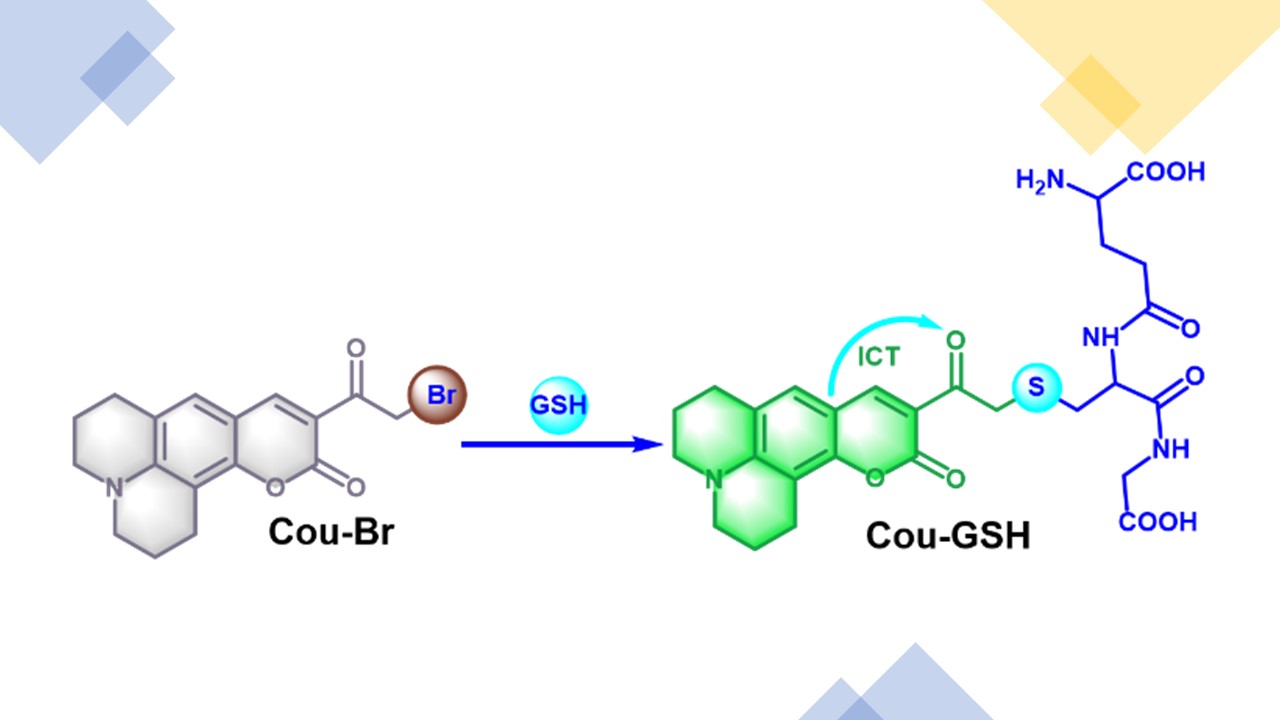
Scheme 1. The molecular structure of Cou-Br and its proposed response mechanism towards GSH.
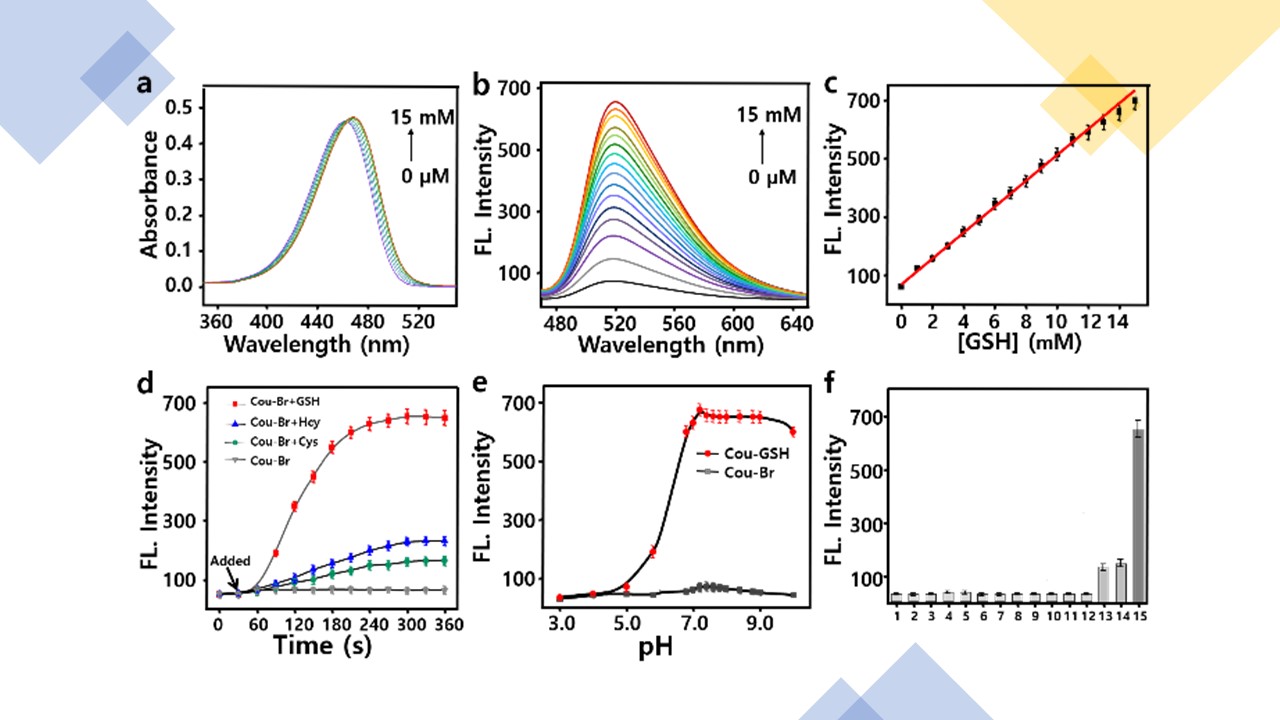
Figure 1. Spectral properties and selectivity of Cou-Br. a) Absorbance spectra of Cou-Br (10 μM) towards GSH. Data were recorded after 5 min incubation with increasing concentration of GSH (0 - 15 mM) in HEPES (pH 7.4, 10 mM); b) Dose-dependent emission spectra of Cou-Br (10 μM) towards GSH. λem=520 nm; c) The linear relationship between the fluorescence (FL.) intensities at 520 nm and GSH concentrations (0 - 15 mM); d) Time-dependent fluorescence intensity of probe Cou-Br towards GSH (10 mM), Cys (15 mM) and Hcy (15 mM) during 0 - 360 s, respectively; e) The fluorescence signal changes of Cou-Br (10 μM) and Cou-GSH (10 μM) at various pH values from 3.0 - 10.0 (10 mM HEPES buffer). f) Fluorescence intensity (at 520 nm) of Cou-Br (10 μM) responding to various analytes in HEPES. 1, blank; 2, Histidine (10 μM); 3, Glycine (10 μM); 4, Alanine (10 μM); 5, Glutamic acid (10 μM); 6, Arginine (10 μM); 7, Proline (10 μM); 8, Methionine (10 μM); 9, Tyrosine (10 μM); 10, Lysine (10 μM); 11, Tryptophan (10 μM); 12, Serine (10 μM); 13, Hcy (15 mM); 14, Cys (15 mM); 15, GSH (10 mM). The experiments were repeated three times and the data were shown as mean (± s.d.).

Figure 2. Confocal microscopy images (λex = 900 nm, λem = 500 – 540 nm) and flow cytometry assays (λex = 480 nm, λem = 500 – 540 nm) for the detection of GSH in different cell lines. a) Fluorescent imaging of GSH in FaDu cells at time points: 0, 5, 10, 30 and 60 min; b) Fluorescent imaging of the GSH in different cells lines: human pharyngeal carcinoma cell line (FaDu cell line), human non-small cell lung cancer cell line (A549), human hepatocellular liver carcinoma cell line (HepG2), human ovarian cancer cell line (OVCRA-3) and human gastric adenocarcinoma cell line (SGC-7901); c) Fluorescent imaging of the GSH in FaDu cells exposed to different stimulation agents: N-ethylmaleimide (NEM, 5 mM), Hcy (5 mM), glutathione monoethyl ester (GSH-MEE, 5 mM), and Cys (0.5 mM) were separately added in each group and incubated for 30 min. d - f) Mean fluorescence intensities of images in a - c; g - i) Flow cytometry analyses of images in a - c; j - l) Mean values of figure g - i. The data were shown as mean (± s.d.).

Figure 3. Detection of the GSH fluctuation in living FaDu cells with Cou-Br. Fluorescence collection windows: Ch1: λex = 900 nm, λem = 500 – 540 nm; Ch2: λex = 750 nm, λem = 800 – 850 nm; Ch3: λex = 545 nm, λem = 600 – 700 nm. The FaDu cells were treated with Cys (100 μM, 24h), CS2 (5 μM, 6h) as well as Cys (100 μM, 24h) and CS2 (5 μM, 6h), respectively. Consequently, Cou-Br (10 μM) and Cy-PFS (10 μM) were added simultaneously and incubated for 10 min at 37 °C before confocal imaging and flow cytometry analyses. a) Fluorescent imaging of GSH (channel 1, abbreviated as Ch1, so as the following), H2O2 (Ch2, fluorescence collection windows: λex = 750 nm, λem = 800 – 850 nm) (Ch3: λex = 545 nm, λem = 600 – 700 nm), and the ratio of Ch3/Ch2. b) Flow cytometry analyses for the cells in a; c) Apoptosis detection by flow cytometry analysis. Q1: necrosis cells, Q2: late apoptotic cells, Q3: early apoptotic cells, Q4: survival cells; d) Mean fluorescence intensities of the images in a (Ch1); e) Mean values of b (Ch1); f) The average ratio values in a (Ch3/Ch2); g) The average ratio values in b (Ch3/Ch2). The data were shown as mean (± s.d.).

Figure 4. Time-dependent fluorescence images in subcutaneous and orthotopic laryngeal carcinoma mice models (λex = 480 nm, λem = 500 - 550 nm). a) Fluorescence images of GSH with Cou-Br (intertumoral injection, 50 μM, 50 μL in DMSO : saline = 1 : 99, v:v) in subcutaneous laryngeal cancer mice model; b) Fluorescence images of GSH with Cou-Br (local spray, 50 μM, 50 μL in DMSO : saline = 1 : 99, v:v) in orthotopic laryngeal cancer mice model; The red arrows indicated the location of subcutaneous and orthotopic tumor, respectively. c) Region of interest (ROI): the imaging and H&E staining of orthotopic tumor with Cou-Br for 60 min; d) H&E staining of subcutaneous and orthotopic laryngeal cancer tissue, respectively.
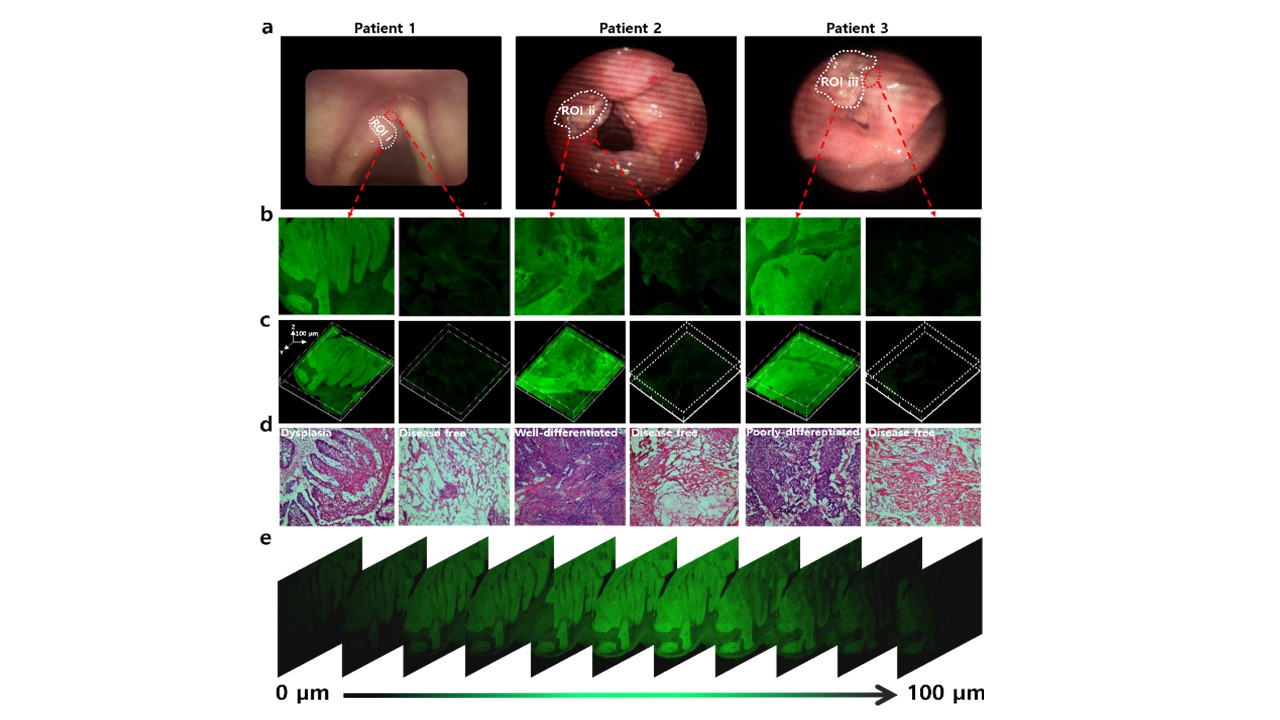
Figure 5. Fluorescence images of human fresh frozen laryngeal carcinoma of different pathological and disease-free tissue (λex = 900 nm, λem = 500 - 550 nm). The slices incubated with Cou-Br (10 μM) for 30 min. a) Pre-operative electronic fiber laryngoscopy of the above three individual patients. b) The fluorescence images of lesion tissues (ROI i, ii and iii) and surrounding disease-free tissue (100 μm thickness); c) The three-dimensional (3D) images of b; d) H&E staining of b; e) Mapping of z-line sequential images for dysplasia slice at a depth interval of 10 μm.
https://blog.sciencenet.cn/blog-2438823-1211456.html
上一篇:功能材料和分子影像研究所招聘---山东大学/中科院大连化学物理研究所(博士后招聘)待遇从优
下一篇:Self-assembled nanomaterials for phototherapy of cancer
全部作者的其他最新博文
- • Triphenylamine-AIE Materials for Cancer Theranostics
- • Fluorescent Probe forRatiometric Monitoring of Peroxynitrite
- • Fluorescence Probe for Pathological Stages of Wound Healing
- • Macrophage M2 polarization to neurological damage
- • SERS-RCA biosensor for profiling dual miRNAs
- • a glutathione-activated near-infrared fluorescent probe