博文
[转载]python plot log axis
|||
Logarithmic and other nonlinear axes
matplotlib.pyplot supports not only linear axis scales, but also
logarithmic and logit scales. This is commonly used if data spans many orders
of magnitude. Changing the scale of an axis is easy:
plt.xscale('log')
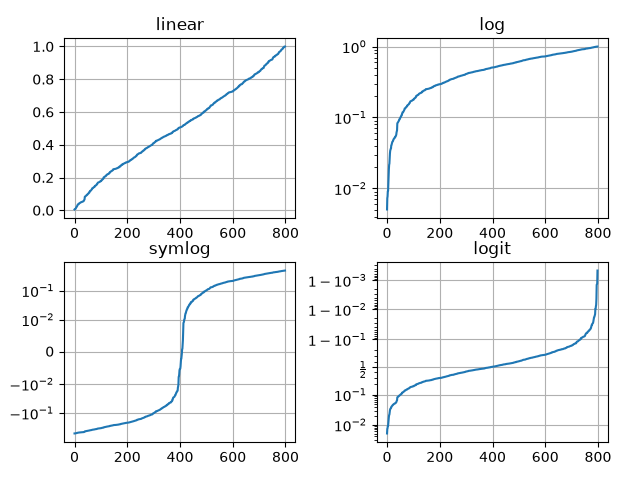
An example of four plots with the same data and different scales for the y axis is shown below.
# Fixing random state for reproducibilitynp.random.seed(19680801)# make up some data in the open interval (0, 1)y = np.random.normal(loc=0.5, scale=0.4, size=1000)y = y[(y > 0) & (y < 1)]y.sort()x = np.arange(len(y))# plot with various axes scalesplt.figure()# linearplt.subplot(221)plt.plot(x, y)plt.yscale('linear')plt.title('linear')plt.grid(True)# logplt.subplot(222)plt.plot(x, y)plt.yscale('log')plt.title('log')plt.grid(True)# symmetric logplt.subplot(223)plt.plot(x, y - y.mean())plt.yscale('symlog', linthresh=0.01)plt.title('symlog')plt.grid(True)# logitplt.subplot(224)plt.plot(x, y)plt.yscale('logit')plt.title('logit')plt.grid(True)# Adjust the subplot layout, because the logit one may take more space# than usual, due to y-tick labels like "1 - 10^{-3}"plt.subplots_adjust(top=0.92, bottom=0.08, left=0.10, right=0.95, hspace=0.25,
                    wspace=0.35)plt.show()
It is also possible to add your own scale, see Developer's guide for creating scales and transformations for details.
https://blog.sciencenet.cn/blog-587102-1278206.html
上一篇:[转载]归一化 (Normalization)、标准化 (Standardization)和中心化/零均值化 (Zero-cen
下一篇:[转载]文献管理 endnote zotero 视频
扫一扫,分享此博文