博文
A case study of optimal experimental design with Matlab
|
%% A case study of optimal experimental design
% To determine the optimum time to run experiments
% Such that parameters will have minimum error
% this is a forward problem only
% 双参数 Model: y=beta1*exp(-beta2*t)
% Criterion: maximization of the determinant of X'*X
% Cij=(intergral of (Xi*Xj) dt)/(tn)
% X represents the sensitivity matrix or scaled sensitivity coefficients X'
%% set up times
close all
clear
t=0:0.1:2; % time series points,共21个时间点
m=length(t);
%% initial parameter guesses for SSC
beta(1)=1;%
beta(2)=1;%
%% define and plot the function
modfunc=@(beta,t) beta(1)*exp(-beta(2)*t);
Y=modfunc(beta,t);
plot(t,Y);
xlabel('t');
ylabel('Y');
%% Compute C11, C12,...delta for opt exptl design
% Xp are the scaled sensitivity coefficients
% SSC_V4.m 每个参数的SSC以元胞单位输出
Xp=SSC_V4(beta,t,modfunc); % compute scaled sensitivity coefficients as a cell array
% if XX=Xp{i}, XX is a row vector
n=length(beta); % number of parameters
% Two loops to compute entire C matrix
for i=1:n
for j=1:n
intgrnd=Xp{i}.*Xp{j}; % a row vector
C{i,j}=(1./t).*cumtrapz(t,intgrnd); % accumulative integration: cumtrapz to compose the C matrix
% C{i,j}以元胞数组存储,元胞内为1*21行向量,每个元素对应一个时间点
% C为对角矩阵
% clear intgrnd
end
end
% to compute delta, must set up the C matrix for each time
% extract C into a 3-D matrix we call "CC" 构建三维C矩阵
for i=1:n
for j=1:n
CC(i,j,:)=C{i,j}; % gives a 3D matrix that is m (depth) in time
% 将C每一个向量元胞元素存于CC的每一页,CC三维矩阵纵深方向
% CC每一页为一个时间点的C矩阵,C=[C11,C12;C21,C22];
end
end
% 第一页
CC(:,:,1)=0; % beginning values at time = 0 are zero 起始积分为0
CC(1,1,1)=1; % except for C11, for the initial value
delta(1)=0; % determinant at time zero = 0. 起始页行列式为0
% 其他页面
for k=2:m
delta(k)=det(CC(:,:,k)); % 其他页行列式
end
% delta=sqrt(delta);%converts units of delta to same as units for C
% 从三维CC矩阵中按页(时间)方向提取系列元素绘Cij图
% CC的每一页为2*2矩阵,因为只有两个参数
% convert 3D to 2D for plotting
% C matrix is symmetrical, so need only one half
i=1;
d=1;
% "Cp" is "C for plotting"
% for first row, i =1
for j=1:n
Cp(d,:)=CC(i,j,:); % i=1, 提取C11,C12系列,存储于Cp的每一行
d=d+1;
end
%for second row, i=2
i=2;
for j=2:n % 不比提取C21,因为C21=C12
Cp(d,:)=CC(i,j,:); % i=2; 提取C22系列,接着存于Cp的下一行
d=d+1;
end
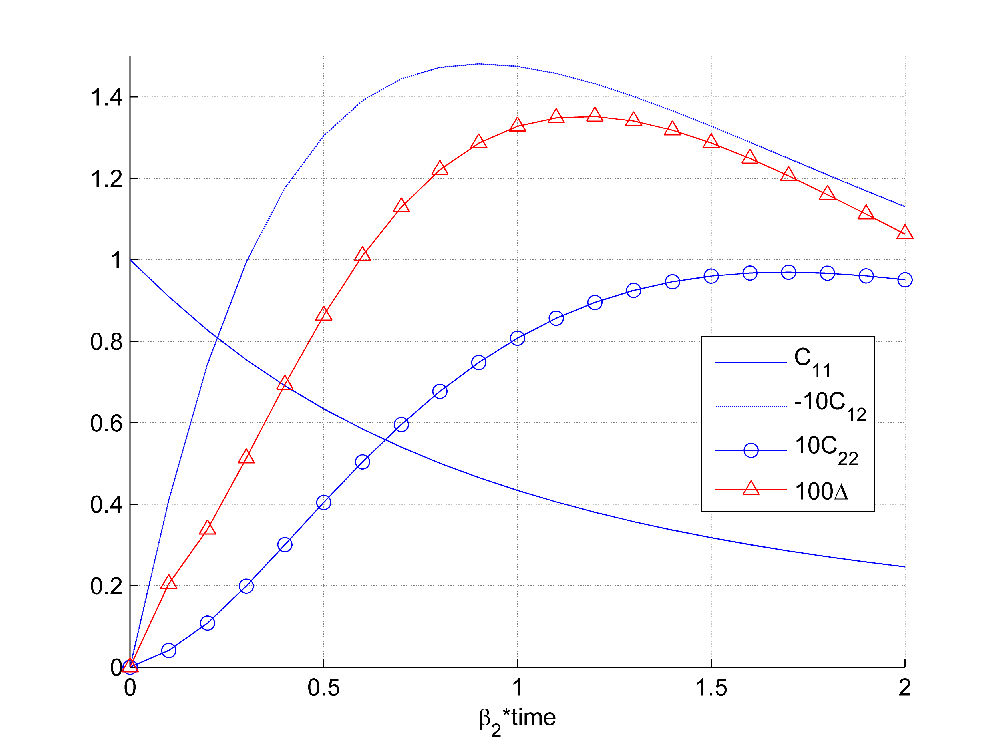
%% plot the results
figure
hold on
f=10;
% The size of the curves do not matter, only the shape
% An Arbitrary value can be used to multiply each curve
% All the curves appear on one plot, and the maxima can be easiliy identified
h(1)=plot(t,Cp(1,:),'-'); % C11
h(2)=plot(t,-f*Cp(2,:),'--'); % C12
h(3)=plot(t,f*Cp(3,:),'-o'); % C22
h(4)=plot(t,10*f*delta,'-^r'); % delta
plot([0 max(t)],[0 0],'-r')
set(gca,'YTick',0:.2:1.6)
xlabel('beta_2*time')
legend('C_{11}','-10C_{12}','10C_{22}','100Delta','Location','Best')
grid on
% The plot of delta vs time is to see the maxium and choose that as the optimal time of the experiment
% The plot of Cij vs time is to see where the maxima are for each parameter
% The optimal duration of an experiment for both beta1 and beta2 is the time at which delta is a maxim

https://blog.sciencenet.cn/blog-578676-845760.html
上一篇:A case study of model discrimination with Matlab
下一篇:Bootstrapping in nonlinear parameter estimtion with Matlab