博文
土地开发分类:Classifying land development in high-resolutio
|||
Unsalan, C.; Boyer, K.L.;
Geoscience and Remote Sensing, IEEE Transactions on
Volume: 42 , Issue: 4
Digital Object Identifier: 10.1109/TGRS.2003.818835
Publication Year: 2004 , Page(s): 907 - 919
Cited by: 18
方法概述:将影像分为一个个方块,根据方块的特征将其分类。值得介绍的是其选用的特征:直线统计特征。
一、特征选择
线段的提取方法是采用经典的Burns的方法。方块的直线统计特征分两类:线段长、对比度。共四个特征:平均线段长、线段长度的熵、对比度均值、对比度的熵。
选择线段长的统计特征作特征的依据:In wilderness (or rural) regions,due to the absence of human activity,we expect shorter and more randomly distributed straight lines。荒地由于很少有人类活动,其上的线段平均长度更短、长度的分布也更随机。
选择对比度特征的依据:In urban regions for example, we encounter greater variation in the color of buildings, sharp dark–light transitions between asphalt roads and shiny roofs, and the juxtaposition of buildings and vegetation. Such high-contrast variations are less likely in wilderness (or rural) regions.在人造地物区域,对比度更明显,在野外则对比度则小一些。
对比度的定义比较有意思: 定义为每个线支持区域(Line-Supported Region)中的最大梯度(x方向或y方向的梯度,实际上就是对比度)。
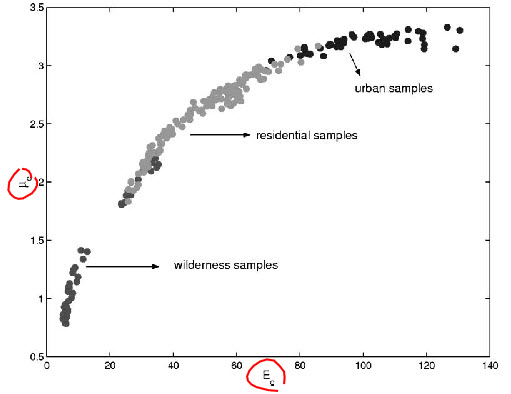
样本的对比度分布如上图,图中显示,城市区域的对比度均值和熵都大,野外的都小,郊区的居中。有较好的区分度。
二、感知编组
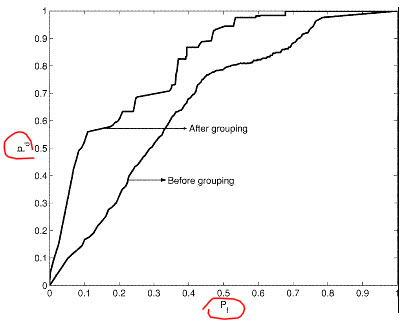
采用感知编组的方法对图像块进行编组。据说编组后的ROC曲线得到改善。但是没读懂为什么。上ROC曲线图
三、分类
实验采用Bayesian分类器。并试图与最近邻、Parzen窗分类器比较
https://blog.sciencenet.cn/blog-471807-535047.html
上一篇:遥感图像处理与模式识别领域国际会议
下一篇:CRF+MRF作目标检测
