博文
Python_机器学习_总结1:基于Rossenblatt感知器分类Iris
|
#摘至《Python 机器学习》,作者:Sebastian Raschaka, 机械工业出版社;
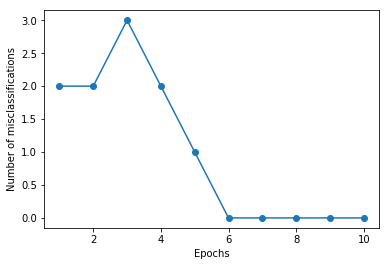
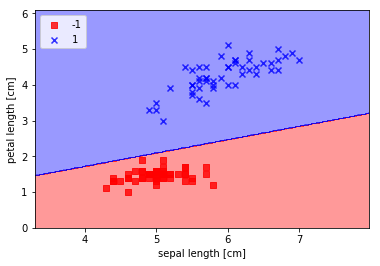
虽然很简单,但是能够理解整个过程,包括样本数据读取、样本显示、训练过程(权重更新过程)、训练误差跟踪、接触界面可视化;
# -*- coding: utf-8 -*-
"""
Created on Mon Aug 20 14:12:30 2018

@author: lijun
"""
######################################################################################################
#Rossenblatt感知器
import numpy as np
class Percentron(object):
    def __init__(self, eta = 0.1, n_iter = 10):
        self.eta = eta
        self.n_iter = n_iter

    def fit(self, X, y):
        self.w_ = np.zeros(1 + X.shape[1])
        self.errors_  = []

        for _ in range(self.n_iter):
            errors = 0
            for xi, target in zip(X, y):
                update = self.eta * (target -self.predict(xi))
                self.w_[1:] += update * xi
                self.w_[0] += update
                errors += int(update != 0)
            self.errors_.append(errors)
        return self

    def net_input(self, X):
        return np.dot(X, self.w_[1:]) + self.w_[0]

    def predict(self, X):
        return np.where(self.net_input(X) >= 0.0, 1, -1)


######################################################################################################
#读取数据集
import pandas as pd
df = pd.read_csv('https://archive.ics.uci.edu/ml/machine-learning-databases/iris/iris.data', header = None)
print(df.tail())
######################################################################################################
#显示所有样本点
import matplotlib.pyplot as plt
y = df.iloc[0:100, 4].values
y = np.where(y == 'Iris-setosa', -1, 1)
X = df.iloc[0:100, [0,2]].values
plt.scatter(X[:50,0], X[:50, 1], color = 'red', marker = 'o', label = 'setosa')
plt.scatter(X[50:100, 0], X[50:100, 1], color = 'blue', marker = 'x', label = 'versicolor')
plt.xlabel('petal length')
plt.ylabel('sepal length')
plt.show()
######################################################################################################
# 训练,并跟踪误差收敛
ppn = Percentron(eta = 0.1, n_iter = 10)
ppn.fit(X,y)
plt.plot(range(1, len(ppn.errors_) + 1), ppn.errors_, marker='o')
plt.xlabel('Epochs')
plt.ylabel('Number of misclassifications')
plt.show()
######################################################################################################
# 决策边界可视化函数
from matplotlib.colors import ListedColormap

def plot_decision_regions(X, y, classifier, test_idx= None, resolution=0.02):
    #setup marker generator and color map
    markers = ('s', 'x', 'o', '^','v')
    colors = ('red', 'blue', 'lightgreen', 'gray', 'cyan')
    cmap= ListedColormap(colors[:len(np.unique(y))])

    #plot the decison surface
    x1_min, x1_max = X[:, 0].min() - 1, X[:, 0].max() + 1
    x2_min, x2_max = X[:, 1].min() -1 , X[:, 1].max() + 1

    xx1,xx2 = np.meshgrid(np.arange(x1_min, x1_max,resolution), np.arange(x2_min, x2_max,resolution))

    Z = classifier.predict(np.array([xx1.ravel(), xx2.ravel()]).T)
    Z = Z.reshape(xx1.shape)

    plt.contourf(xx1, xx2, Z, alpha = 0.4, cmap = cmap)
    plt.xlim(xx1.min(), xx1.max())
    plt.ylim(xx2.min(), xx2.max())

    #plot all samples
    for idx, cl in enumerate(np.unique(y)):
        plt.scatter(x= X[y==cl, 0], y = X[y==cl, 1],
            alpha=0.8, c=cmap(idx), marker= markers[idx],label = cl)
######################################################################################################
plot_decision_regions(X, y, classifier = ppn)
plt.xlabel('sepal length [cm]')
plt.ylabel('petal length [cm]')
plt.legend(loc = 'upper left')
plt.show()
***********************************************************************************************************************


补充:
1、iloc : https://blog.csdn.net/hecongqing/article/details/61927615
2、tail() : https://pandas.pydata.org/pandas-docs/stable/generated/pandas.DataFrame.tail.html
https://blog.sciencenet.cn/blog-3377553-1130235.html
上一篇:Python_机器学习_总结1:Rossenblatt感知器
下一篇:Python_机器学习_总结3:利用Adaline算法分类Iris