博文
Fluorescent Probe for GSH S-Transferase on IPF Therapy
|
Evaluation of Glutathione S-Transferase Inhibition Effects on Idiopathic Pulmonary Fibrosis Therapy with a Near-Infrared Fluorescent Probe in Cell and Mice Models
Na He,‡1,4 Song Bai,‡1,4 Yan Huang,2 Yanlong Xing,3 Lingxin Chen,*2 Fabiao Yu,*3& Changjun Lv*1,4
1 Department of Respiratory Medicine, Binzhou Medical University Hospital, Binzhou 256603, China.
2 Key Laboratory of Coastal Environmental Processes and Ecological Remediation, Yantai Institute of Coastal Zone Research, Chinese Academy of Sciences, Yantai 264003, China.
3 Institute of Functional Materials and Molecular Imaging, College of Clinical Medicine, Key Laboratory of Hainan Trauma and Disaster Rescue, College of Emergency and Trauma, Hainan Medical University, Haikou 571199, China.
4 Medicine Research Center, Institute of Molecular Medicine, Binzhou Medical University, Yantai 264003, China.
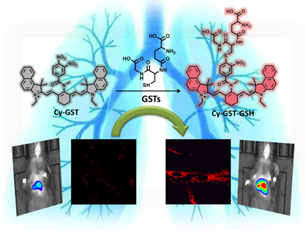
Idiopathic pulmonary fibrosis (IPF) is a lung limited and progressive fibrotic disease. The early diagnosis and therapies of IPF are still full of clinical challenges. Glutathione S-transferase (GSTs) plays significant roles in promoting the formation of pulmonary fibrosis. Herein, we report a fluorescent probe (Cy-GST) for the detection of GSTs concentration fluctuations in cells and in mice models. The probe can selectively and sensitively respond to GSTs with an “off-on” type fluorescence switch. Our results demonstrated that the level of intracellular GSTs increase in the pulmonary fibrosis cells and mice models. And the IPF patients hold high levels of GSTs concentrations. Thus, GSTs is likely to play important roles in pulmonary fibrosis. The inhibitor of GSTs TLK117 can reduce the severity of pulmonary fibrosis. The Synergistic treatment of TLK117 and pirfenidone have better therapeutic effects than only using pirfenidone in pulmonary fibrosis mice models. The level of GSTs in IPF may be a new potential marker for IPF diagnosis. And the inhibition of GSTs may be a new therapeutic strategy for the IPF treatment.

Anal. Chem., Article ASAP
DOI: 10.1021/acs.analchem.9b00713
Publication Date (Web): March 14, 2019
Copyright © 2019 American Chemical Society
https://pubs.acs.org.ccindex.cn/doi/abs/10.1021/acs.analchem.9b00713
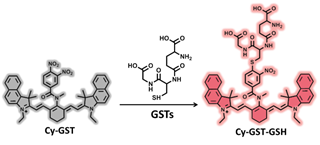
Scheme 1 Proposed detection mechanism of the probe Cy-GST against GSTs.


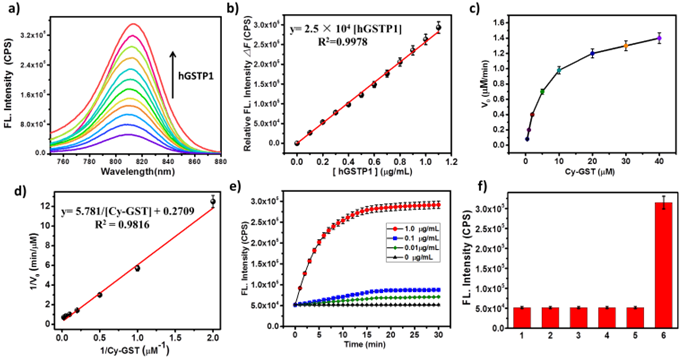
Figure 1. Spectral properties and enzymatic properties of Cy-GST in the presence of 0.1 mM GSH at 37 °C 10 mM HEPES (pH 7.4) with λex/λem = 730/810 nm. a) Fluorescence emission spectra changes of Cy-GST (10 μM) with concentrations of hGSTP1 (0, 0.1, 0.2, 0.3, 0.4, 0.5, 0.6, 0.7, 0.8, 0.9, 1.0 and 1.1 μg/mL). b) The linear relationship between the relative fluorescence intensity and hGSTP1 (0-1.1 μg/mL). c) Michaelis-Menten plot and d) Lineweaver-Burke plot of the reaction between variable concentrations Cy-GST (0.5-40 μM) and hGSTP1 (1 μg/mL). e) Fluorescence intensity of Cy-GST (10 μM) against the reaction time in the presence of concentrations of hGSTP1 (0, 0.01, 0.1, 1.0 μg/mL). f) Fluorescence responses of Cy-GST (10 μM) in the presence of 0.1 mM GSH to various analogous functional enzymes for 10 min: 1. horseradish peroxidase (1.0 μg/mL) (NADH as coenzyme), 2. nitroreductase (1.0 μg/mL) (NADH as coenzyme), 3. γ-glutamyl transpeptidase (1.0 μg/mL), 4. alkaline phosphatase (1.0 μg/mL), 5. β-galactosidase (1.0 μg/mL), 6. hGSTP1 (1.0 μg/mL).

Figure 2. Confocal microscopy images and flow cytometry assay of IMR-90 and RLE-6TN cells for evaluating the fluctuation of GSTs in living cells. a) Real-time GSTs quantification with Cy-GST (5 μM) in IMR-90 and RLE-6TN cells at 37 °C at different time points: 0, 10, 20, and 30 minutes by confocal laser-scanning microscope with an objective lens (×60) as control. b) Before treated as described in the control, IMR-90 cells and RLE-6TN cells were incubated with TLK117 50 μM for 24 h for imaging. c) IMR-90 cells and RLE-6TN cells were treated as described in the control after IMR-90 cells and RLE-6TN cells of GSTs transfection. d) Flow cytometry analysis of a), b) and c). e), f) Confirmation of decreased GSTs activity upon administration of TLK117 and increased GSTs activity upon GSTs transfection in IMR-90 cells and RLE-6TN cells. g) Mean fluorescence intensity of IMR-90 cells. h) Mean fluorescence intensity of RLE-6TN cells. (Red channel: λex = 730 nm, λem = 800 - 850 nm). Images are representative of n = 5 independent experiments. Scale bars: 20 μm.

Figure 3. The fluctuation of GSTs and ROS in IMR-90 cells and RLE-6TN cells under oxidative stress condition and pulmonary fibrosis cell models. a) Confocal microscopy images and flow cytometry assay of GSTs with Cy-GST (5 μM) in IMR-90 and RLE-6TN cells for 30 minutes as control. Before treated as described in the control, then the cells were incubated with 50 μM paraquat for 8 h. b) Confocal microscopy images and flow cytometry assay of ROS with DHE (10 μM) in IMR-90 and RLE-6TN cells for 30 minutes as control, then the cells were incubated with 50 μM paraquat for 8 h. c) Mean fluorescence intensity of the images a) and b). d) Western Blot analysis GSTs protein changes of IMR-90 and RLE-6TN cells. β-actin was used as internal control. e) Quantitative of GSTs protein expression in d). f) Real-time GSTs imaging with Cy-GST (5 μM) in IMR-90 and RLE-6TN cells as control. Before treated as described in the control, IMR-90 cells and RLE-6TN cells were incubated with 50 μM TGF-β1 for 72 h to establish the pulmonary fibrosis cell models. Pulmonary fibrosis cell models were incubated with 50 μM TLK117 for 24 h, and then processed according to the steps of the control group. g) The mean fluorescence intensity of f). h) Western Blot analysis GSTs protein, E-cadherin protein and α-SMA protein changes of IMR-90 and RLE-6TN cells in f). Confirmation of GSTs activity in IMR-90 cells i) and RLE-6TN cells j) of those shown in f). β-actin was used as internal control. Quantitative of GSTs protein k), E-cadherin protein l) and α-SMA protein m) expression in h). Red channel: λex = 730 nm, λem = 800 - 850 nm. Green channel: λex = 535 nm, λem = 590 - 610 nm. Data are presented as mean ± SD (n = 5). Scale bars: 20 μm.

Figure. 4 Imaging of GSTs level in pulmonary fibrosis mice models and the treatment effect of synergistic TLK117 and PFD. Fluorescence collection windows were the following: 800 - 850 nm, λex = 730 nm. a) GSTs concentrations in different test groups according to different stimulus days by bleomycin: 0 day, 7 days, 14 days, 21 days and 28 days, and TLK117 group mice were administered oropharyngeally with TLK117 50 mg/kg once every 3 days for 28 days after bleomycin treated 28 days. PFD group mice were orally administrated with PFD 300 mg/kg daily for 28 days after bleomycin treated 28 days. TLK117+PFD group were simultaneously orally administrated with TLK117 and PFD as previously described. All the pulmonary fibrosis mice models were incubated with Cy-GST (100 μM, 50 μL in 1:99 DMSO/saline, v/v) for 30 min with intratracheal administration before fluorescence imaging in vivo. b) Fluorescence imaging of isolated organ (heart, liver, spleen, lung, and kidney) imaging. c) Fluorescence imaging and merge imaging of fluorescence imaging and bright field (Figure S11) of lung slices of different test groups by treated with Cy-GST. Scale bar: 60 μm. d) H&E pathology of different test groups. e) Masson pathology of different test groups. f) Mean fluorescence intensity of the images a). g) Quantitative of GSTs protein expression in j). Quantitative of E-cadherin protein h) and α-SMA protein i) expression in k). j) Western blot analysis GSTs protein changes of lung tissue in different stimulus days by bleomycin, β-actin was used as internal control. k) Western Blot analysis E-cadherin protein and α-SMA protein changes of lung tissue in different test groups, β-actin was used as internal control. Fluorescence imaging channel: λex = 730 nm, λem = 800 - 850 nm. Data are presented as mean ± SD (n = 5).

Figure 5. The fluorescence imaging of GSTs in the lung tissues of healthy control and IPF patient groups (λex = 730 nm, fluorescence collection window: 800 - 850 nm). Shown are the data from two independent experiments (n=6 in each group). Scale bars: 60 μm.
https://blog.sciencenet.cn/blog-2438823-1169751.html
上一篇:[转载]Science:寄生虫的细胞外囊泡
下一篇:超分辨显微成像技术
全部作者的其他最新博文
- • Triphenylamine-AIE Materials for Cancer Theranostics
- • Fluorescent Probe forRatiometric Monitoring of Peroxynitrite
- • Fluorescence Probe for Pathological Stages of Wound Healing
- • Macrophage M2 polarization to neurological damage
- • SERS-RCA biosensor for profiling dual miRNAs
- • a glutathione-activated near-infrared fluorescent probe